??  ZGC (Z Garbage Collector) in Java: Low-Latency Garbage Collection for Large Heaps ??

?? ZGC (Z Garbage Collector) in Java: Low-Latency Garbage Collection for Large Heaps ??

ZGC (Z Garbage Collector) is a low-latency garbage collector introduced in Java 11 and is designed to provide extremely short pause times—measured in milliseconds—regardless of heap size. ZGC is particularly useful in applications with large heaps (multi-gigabyte) and strict latency requirements, like real-time processing or large-scale systems.


Let's break down the ZGC algorithm in detail, its features, and how it works in the JVM.


Key Features of ZGC (Z Garbage Collector)

Low Latency:

  • ZGC is designed to provide pause times that are typically under 10ms, even for heaps that are multi-terabyte in size.
  • It does this by doing most of its work concurrently with the application running, using parallelism and asynchronous operations.


Scalability:

  • ZGC can scale to very large heap sizes (up to multi-terabyte heaps) without compromising on pause time.
  • ZGC is heap-size-agnostic, meaning it does not suffer from large heap overheads that can affect other garbage collectors like CMS or G1GC.


Concurrent and Parallel:

  • ZGC uses a concurrent marking phase, allowing it to run most operations in parallel with application threads.
  • It minimizes stop-the-world pauses to only the critical phases, such as marking and relocation.


Region-based Heap:

  • Like G1GC, ZGC divides the heap into fixed-size regions for efficient memory management. These regions are dynamically allocated and reclaimed.
  • The heap is split into Young, Old, and Humongous regions, and ZGC collects them based on need.


How ZGC Works


Initial Mark (Stop-the-World Phase):

  • Objective: Quickly mark the GC roots—live objects that can be reached directly from static variables, local variables, or active threads.
  • Stop-the-world: This phase briefly pauses application threads (though this is kept extremely short).


Concurrent Marking:

  • Objective: Concurrently mark all live objects in the heap.
  • ZGC performs a root scanning and object graph traversal while the application is still running, identifying live objects in parallel with application threads.
  • During this phase, the GC maintains remembered sets (RSets) to track references between regions, ensuring that all references are accounted for.

Concurrent Relocation:

  • Objective: Move live objects in memory to improve locality and compact the heap, reducing fragmentation.
  • ZGC relocates objects to new regions to consolidate free space.
  • This phase also happens concurrently, meaning the application runs while the relocation is happening in the background.

Remark (Stop-the-World Phase):

  • Objective: Finalize the marking of objects.
  • During the remark phase, ZGC ensures that all live objects are correctly marked, and any missing references due to concurrent object allocation are processed.
  • This phase also includes handling any object references modified during concurrent marking.

Cleanup:

  • Objective: Reclaim memory and recycle regions that are now fully unused.
  • Any regions that are completely empty after garbage collection are freed up and returned to the heap, making them available for future use.


ZGC's Key Concepts and Techniques

Coloring:

  • ZGC uses a colored object graph to manage object states efficiently:White: Objects that are not yet marked as live.Gray: Objects that are reachable but not yet fully processed.Black: Objects that are confirmed as live.
  • This system helps ZGC track object reachability across generations while minimizing the amount of time spent in stop-the-world phases.


Load Barriers:

  • ZGC uses load barriers (i.e., read barriers) to intercept memory reads and ensure that all references are correctly maintained while the application runs. These barriers are used to track changes in object references, ensuring that live objects remain reachable even when parts of the heap are moved.

Zero-Copy Relocation:

  • When objects are relocated in the heap, ZGC uses zero-copy techniques to efficiently update references to those objects. The object references are updated without needing to copy or move the actual data.

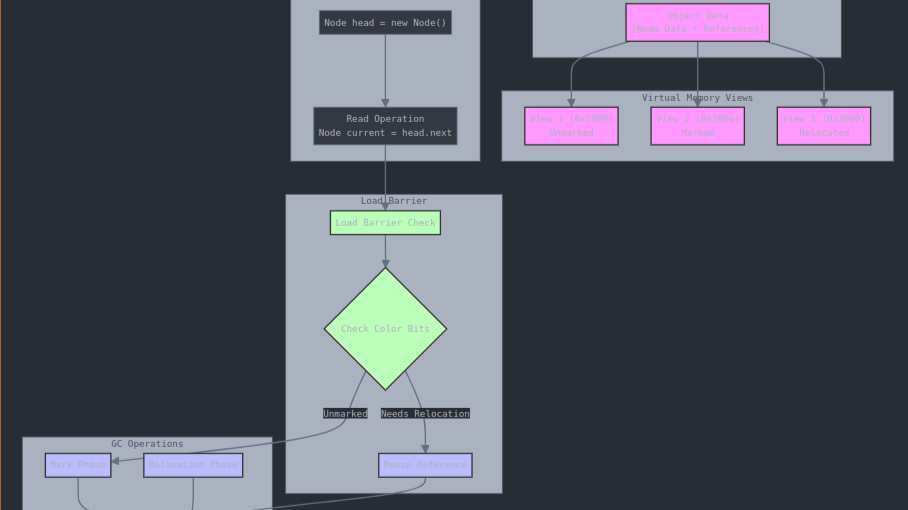
Let me explain how these mechanisms work together in ZGC's garbage collection cycle with a practical example.


Let's say we have this scenario:

class Node {

Object data;

Node next;

}

Node head = new Node(); // Imagine this is in a linked list

Here's how ZGC's mechanisms work together:

Initial State

Virtual Memory: Physical Memory:

0x1000 (View 1) --------→ [Object data]

0x2000 (View 2) --------→ [Same object data]

0x3000 (View 3) --------→ [Same object data]

  • The same physical memory is mapped to multiple virtual addresses
  • Each mapping represents a different state (e.g., marked, relocated)
  • Reference to head might be: 0x1000 with color bits indicating "unmarked"

Marking Phase

// When GC starts marking

head = 0x1000 (unmarked) → becomes → head = 0x1000 (marked)

  • Load barriers check references as application reads them
  • When a reference is loaded, its color bits are checked
  • If unmarked, the barrier marks it and updates the reference

Relocation Phase

Before:

head → [Node@0x1000] → [Node@0x1500]

During:

head → [Node@0x1000] ----→ [Node@0x2000] (being relocated)

\--→ [Node@0x1500]

After:

head → [Node@0x2000] → [Node@0x1500]


  • GC picks regions to relocate
  • Objects are physically copied to new locations
  • References aren't updated immediately


Load Barrier in Action

// Application thread doing:

Node current = head.next;

// Load barrier intercepts and might do:

if (isForwardedPointer(head)) {

head = getForwardedAddress(head); // Updates to new location

}

return head;


  1. Complete Process Example:

Time 0: head = 0x1000 (unmarked)

Time 1: GC starts marking

Time 2: Application reads head → load barrier marks it

Time 3: GC decides to relocate object

Time 4: GC copies object to 0x2000

Time 5: Application reads head again → load barrier remaps to 0x2000


Key Points About How They Work Together:

  1. Concurrent Operation: Application threads continue running Load barriers ensure they always see consistent state No global pause to update references
  2. Memory Efficiency: Multi-mapping means no extra copy needed during relocation Only one physical copy exists despite multiple views Reference updates are distributed over time
  3. Performance Characteristics: Most overhead is in load barriers Barrier cost is amortized across normal execution Pause times typically stay under 1ms

This is why ZGC can achieve:

  • Sub-millisecond pause times
  • Handle huge heaps (multiple terabytes)
  • Maintain high throughput


ZGC Configuration Options

When running ZGC in a Java application, you can use the following JVM flags to configure and fine-tune the garbage collection process:

Enable ZGC:

java -XX:+UseZGC

Set Maximum Heap Size: You can set the maximum heap size using the -Xmx option, depending on your application’s memory needs. For example:

java -XX:+UseZGC -Xmx8G -Xms8G MyApp

Pause Time Goal: You can set the pause time goal for ZGC:

java -XX:+UseZGC -XX:MaxGCPauseMillis=5 -Xmx4G MyApp

Logging: Enable GC logging for detailed insights into how ZGC performs:

java -XX:+UseZGC -Xlog:gc* MyApp


ZGC Performance Characteristics

  • Pause Times: ZGC is optimized for very short stop-the-world pauses. While it may still have some brief pauses during the initial mark and remark phases, most of the work is done concurrently with the application running, making it ideal for latency-sensitive applications.
  • Heap Efficiency: ZGC is efficient at managing large heaps, as it continuously reclaims unused regions and compacts the heap to prevent fragmentation.
  • Scalability: ZGC can handle heaps of sizes in the order of terabytes, making it suitable for large-scale systems and big data applications.


When to Use ZGC?

  • Large Heap Sizes: Applications that require multi-gigabyte or even terabyte heaps (e.g., large data processing systems, big data applications).
  • Low-Latency Requirements: Systems that need predictable and minimal pause times, like real-time systems, gaming, financial trading platforms, and low-latency services.
  • High Scalability: Applications that must scale across multiple nodes or handle massive datasets without degrading performance due to GC overhead.


ZGC is an advanced garbage collection algorithm built for low-latency and large-scale applications. By performing concurrent marking, relocation, and cleanup, ZGC ensures that pause times are minimized while maximizing heap efficiency, making it ideal for large heaps and real-time systems that require highly predictable GC behavior. Its design is particularly suited for environments where traditional collectors like G1GC or CMS may not provide the necessary performance and scalability.

If you're working with large Java applications and need to optimize for low-latency GC, ZGC is an excellent choice.

要查看或添加评论,请登录

Pratik Ugale的更多文章

社区洞察

其他会员也浏览了