Wait for it ... process flow charts are really data flows?
Flow charts are straightforward. To define a business process, draw a box for the next thing that needs to happen, create a specialized shape when there is a decision, and annotate the lines to let the reader know what’s happening. What could be easier? I suppose you could invent a workflow that consisted of sentences or that just watched you work and suggested an optimal flow.
But flow charts hide the most important piece of a process. They don’t explain in detail what’s happening to the underlying data and define how to resolve conflicts.
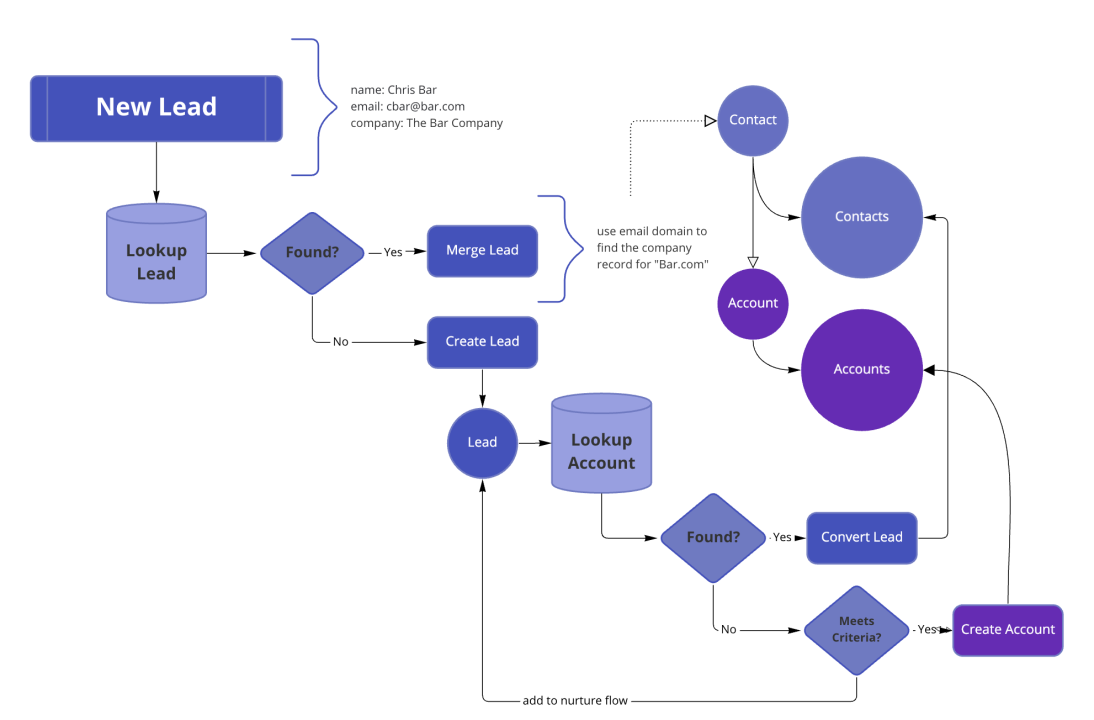
The main reason for this is visual complexity. Think about the start point of a process: you need the reader to understand when it starts and to identify that they are in the process. By definition a process needs one entry point. The best way tot do this in a visual display is to pick an entry point that is undeniable. For example, the figure above shows “New Lead”.
In a typical sales process,?New Lead?means “the first time we’ve encountered a person showing intent to purchase or convert.” The lead could be created from a form fill, attendance at an event, or a person starting a conversation. The starting point for handling that lead is pretty straightforward: they’ve raised their hand. After this happens, the go to market motion springs into action, considering what should be done next, how long it should take, and who needs to take the action.
When creating a process diagram,?most people stop here. They use the process abstraction for a flow chart to generally say what needs to happen and when, and the overall disposition of the result. For example, the chart above details the deduping of a lead (perhaps on email address and name), the matching of that lead to an existing contact and appending data, and perhaps the creation of a new account and contact if qualification criteria is met.
But how does all of that actually happen? Flow creators stop with a pretty picture because they expect other owners (with more knowledge of the data) to fill in the details of how to connect systems. They use the picture of the flow to help stakeholders in other departments understand what’s going on with their intent. And they want the system to reinforce their intent so that metrics, playbooks, and outcomes will be congruent with the flow chart.
Flows hide information by design
Flows don’t tell the whole story. They are a simplification of the data flows that are going on to achieve the results of a flow chart. If you take the lead-to-account matching flow described above and show the the multiple data flows that result, you have a different picture. When a process flow executes as changes in data among objects, there are many other things going on.
We want to describe the process as a series of simultaneous data flows because data flows…
Data flows let you drill down through the abstraction of the flow chart and use the actual data relationships and to demonstrate the changes that cause data to update across related objects to the current data flow. Because we model the simultaneous changes going on, it’s possible to understand the impact of the process flow and when and how it will be applied to the end state of the data.
领英推荐
The same process described as a data flow
How do we move from talking about process flows to talking about data flows?
For our example of lead to account matching, it’s not that much different than the original flow. The main difference is the chain of events that results from the original decision.
When we create the lead, the following happens:
What’s happening? Each decision point in the flow chart corresponds to action in a continuous data flow like this one:
The swim lanes in the diagram above represent three simultaneous processes (and there are more executing at the field level for each of these objects, but you get the idea). Every cycle, each of the object data flows detect changes. When they see a change they execute actions in their pipeline by comparing the values to previously known values.
The basic flow we started with doesn’t show this complexity and tell you what’s really going on. To create the instructions for the input and output of the workflow, you need to define:
Defining the data flows gives you the true picture of the movement for data inside your system. When is this really valuable? When you add the second flow that touches the same object. Flow charts fail to note any potential conflicts, while data flows are expressly designed to define and resolve these issues.
What’s the takeaway??When you’re building a process, go beyond the basic boxes and arrows and create data flows to demonstrate desired data changes, the way you will resolve those changes, and note the data field triggers that start and end a process. Data flows future-proof your organization for integration and help you diagnose issues faster.
Leadership in Data, Analytics and AI for Digital Transformation | Lifelong Learner
1 年Nicely written! This article makes a lot of sense. Completely agree with the central idea of integrating data capture with process steps. However, we need both - a process flow that resonates with a general audience to ensure common understanding of current state (which should not be assumed) and also because not all are concerned with data, and another one as outlined in this article to explain how data is collected and transformed. #processengineering #dataanalytics #datadiscovery #workflows
Experienced Business Analyst | Human-first | Certified Business Process Management Professional | Six Sigma Green Belt | Customer Advocate | Wonder Woman
2 年I love building processes flows for my stakeholders using a human- first approach and watch their eyes light up. People, process, technology and data should be captured in the workflow. The best ones tell a story.
Solutions Leader @ Docusign -- Putting AI pen to Enterprise paper
2 年There's approximately 6 things I can really recollect/still use from college, but understanding how to create ERDs, multi-level Process Flows, and data swimlane charts is a big one. This post is a phenomenal example of how important it is to know your audience and what they need in a process flow ??