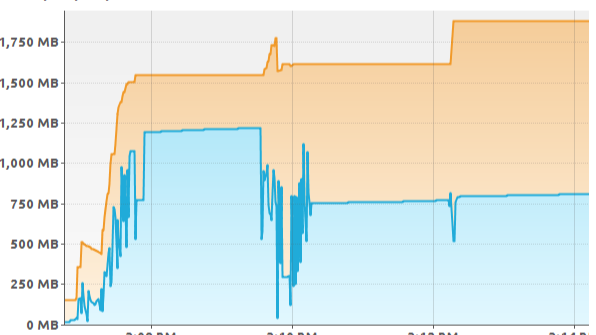
Understanding High Memory Usage vs. Memory Leaks in Java Applications: Real-World Insights
In today's software-driven world, efficient memory management is crucial for maintaining application performance and reliability. However, distinguishing between high memory usage and a memory leak can be challenging. Let’s delve into these concepts with practical examples and actionable insights to help you identify and resolve these issues effectively.
High Memory Usage vs. Memory Leak: What’s the Difference?
High Memory Usage occurs when your application is actively using a large amount of memory due to legitimate needs, such as processing large datasets. Memory Leak, on the other hand, happens when memory is being consumed by objects that are no longer needed but are unintentionally retained, preventing garbage collection.
Real-Time Example: Analyzing a Java Web Application
Imagine you’re managing a Java-based web application that processes large volumes of user data and maintains numerous active sessions. During peak usage times, you notice a significant increase in memory consumption. Understanding whether this is due to high memory usage or a memory leak is crucial for effective performance management.
Scenario 1: High Memory Usage
Example: Your application holds a list of active sessions. Each session stores user data and temporary files. During peak hours, memory usage spikes as more users log in.
Steps to Identify High Memory Usage:
Analyze Object Retention:
Conclusion: If the objects consuming the most memory are part of active sessions and their retention is necessary for normal operations, it indicates high memory usage rather than a memory leak.
Scenario 2: Memory Leak
Example: Your application registers event listeners to handle user actions. Over time, you notice that memory usage continues to increase even when objects should be out of scope. It turns out that these listeners are not being deregistered properly, leading to a memory leak.
领英推荐
Analyze Object Retention:
Follow References:
Conclusion: If objects that should have been released are still being referenced due to static fields, unclosed resources, or endlessly growing collections, it indicates a memory leak.
Practical Analysis Using Eclipse MAT
For High Memory Usage:
For Memory Leak:
Conclusion
Effective memory management is pivotal for application performance. By understanding and differentiating high memory usage from memory leaks, you can take appropriate steps to optimize your application's memory footprint and enhance its stability. Employing tools like Eclipse MAT or VisualVM can provide valuable insights and help address these issues promptly.
Feel free to share your experiences or ask questions about memory management techniques in the comments!
References
Performance, Automation and API Tester at 7Eleven
1 个月Insightful! ??
Performance Test Engineer
2 个月What about memory leaks in dot applications?