Understanding ANOVA
Omkar Sutar
Data Analyst | Power BI Expert | Power Automate Specialist | Python Aficionado
ANOVA, short for Analysis of Variance, is a statistical method used to determine if there is a significant difference between the means of two or more groups. It is a commonly used tool for comparing the means of groups and testing hypotheses about the population means.
The ANOVA process involves three main steps:
1.????Hypothesis Testing: The first step in the ANOVA process is to formulate a null hypothesis and an alternative hypothesis. The null hypothesis states that there is no significant difference between the means of the groups, while the alternative hypothesis states that there is a significant difference.
2.????Data Collection: The next step is to collect data from each group and calculate the sample mean and variance for each group. The data should be collected in a way that reduces the effects of confounding variables.
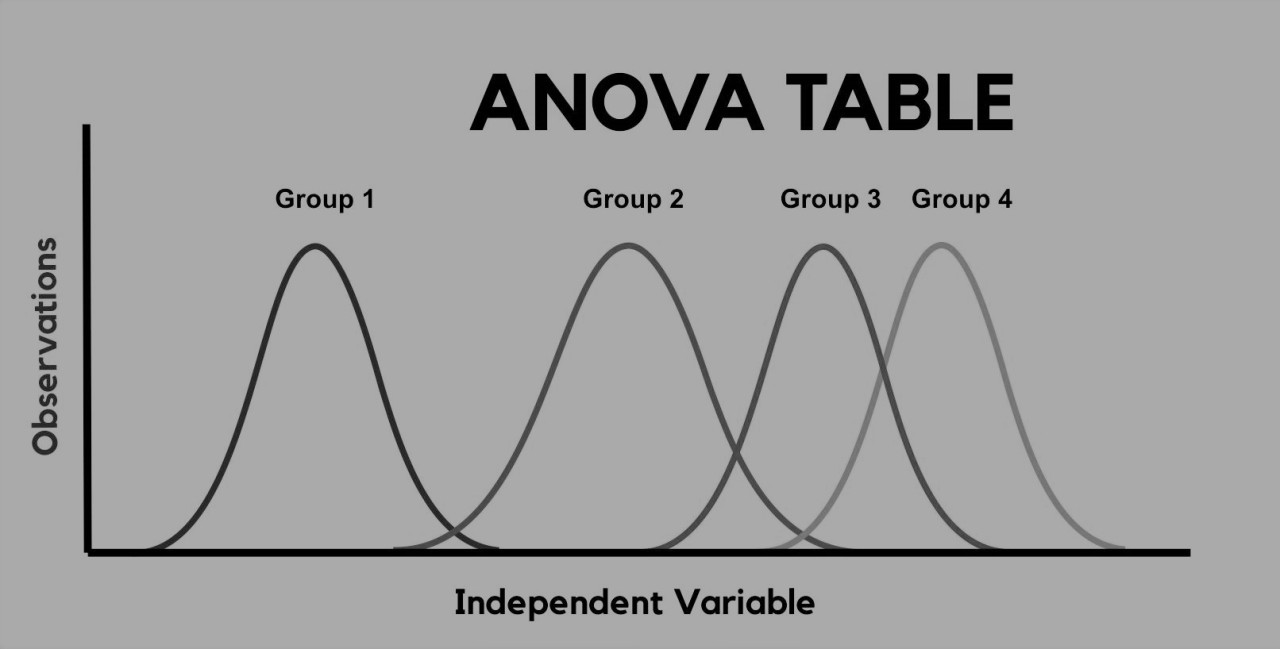
3.????Calculation of the ANOVA Table: The ANOVA table is used to calculate the F-ratio, which is a measure of the ratio of variation between the groups to the variation within the groups. The F-ratio is then compared to a critical value from the F-distribution to determine if the null hypothesis can be rejected.
If the F-ratio is greater than the critical value, the null hypothesis is rejected, and it can be concluded that there is a significant difference between the means of the groups. On the other hand, if the F-ratio is less than the critical value, the null hypothesis is not rejected, and it can be concluded that there is no significant difference between the means of the groups.
One-way ANOVA:
One-way ANOVA is a statistical method used to determine if there is a significant difference between the means of two or more independent groups. It is called "one-way" because it only has one independent variable (also known as a factor) that defines the different groups.
The process of one-way ANOVA involves the following steps:
1.????Formulating the Hypothesis: The null hypothesis states that there is no significant difference between the means of the groups, while the alternative hypothesis states that there is a significant difference.
2.????Data Collection: Data is collected from each group and the sample mean and variance are calculated for each group.
3.????Calculation of ANOVA Test Statistics: The ANOVA test statistic, also known as the F-statistic, is calculated using the sample means and variances of the groups. It measures the ratio of the variance between the groups to the variance within the groups.
领英推è
4.????Determining Significance: The calculated F-statistic is compared to a critical value from the F-distribution to determine if the null hypothesis can be rejected. If the F-statistic is greater than the critical value, the null hypothesis is rejected, and it can be concluded that there is a significant difference between the means of the groups.
5.????Multiple Comparison Tests: If the null hypothesis is rejected, multiple comparison tests such as Tukey's HSD or Bonferroni Correction can be performed to determine which groups have significantly different means.
One-way ANOVA is a commonly used tool in a variety of fields, including psychology, biology, and marketing. It provides a simple and efficient way to compare the means of multiple groups and determine if there is a significant difference between them.
Two-way ANOVA:
Two-Way ANOVA is a statistical method used to determine the effect of two independent variables on a dependent variable. Unlike one-way ANOVA, which only has one independent variable, two-way ANOVA considers the effect of two independent variables on the dependent variable.
The process of Two-Way ANOVA involves the following steps:
1.????Formulating the Hypothesis: The null hypothesis states that there is no significant interaction between the two independent variables, while the alternative hypothesis states that there is a significant interaction.
2.????Data Collection: Data is collected from each group, defined by the combination of levels of the two independent variables, and the sample mean and variance are calculated for each group.
3.????Calculation of ANOVA Test Statistics: The ANOVA test statistic, also known as the F-statistic, is calculated using the sample means and variances of the groups. It measures the ratio of the variance between the groups to the variance within the groups.
4.????Determining Significance: The calculated F-statistic is compared to a critical value from the F-distribution to determine if the null hypothesis can be rejected. If the F-statistic is greater than the critical value, the null hypothesis is rejected, and it can be concluded that there is a significant interaction between the two independent variables.
5.????Post-hoc Tests: If the null hypothesis is rejected, post-hoc tests such as Tukey's HSD or Bonferroni Correction can be performed to determine which groups have significantly different means.
Two-Way ANOVA is a more advanced statistical method compared to one-way ANOVA and is used in a variety of fields, including psychology, biology, and marketing. It provides a powerful tool to study the effect of two independent variables on a dependent variable and determine if there is a significant interaction between them.
Data Analyst|MSc Statistics????|Statistics??
2 å¹´Good Work Omkar Sutar