Simulations and statistical distributions: showcase
Cain? Max Couto da Silva
Data Scientist | Machine Learning Engineer | AI Developer | MLOps | Researcher
Today, I want to share how simulations and statistical distributions are powerful tools in both industry and academic research, bringing as examples two personal projects.
?? First, what are simulations and statistical distributions?
? Simulations: computational methods that generate random data from a specific probability distribution. They allow us to evaluate the plausibility of hypotheses, quantify uncertainty, and estimate model parameters.
? Statistical distributions: describe the probability of different values of a random variable. It is essential for modeling data variability and conducting hypothesis tests.
In the following practical examples, I used simulations and hypothesis testing to understand the data and verify the plausibility of my hypotheses.
?? Practical Applications:
领英推荐
Example 1: Churn Prediction and Prevention Analysis
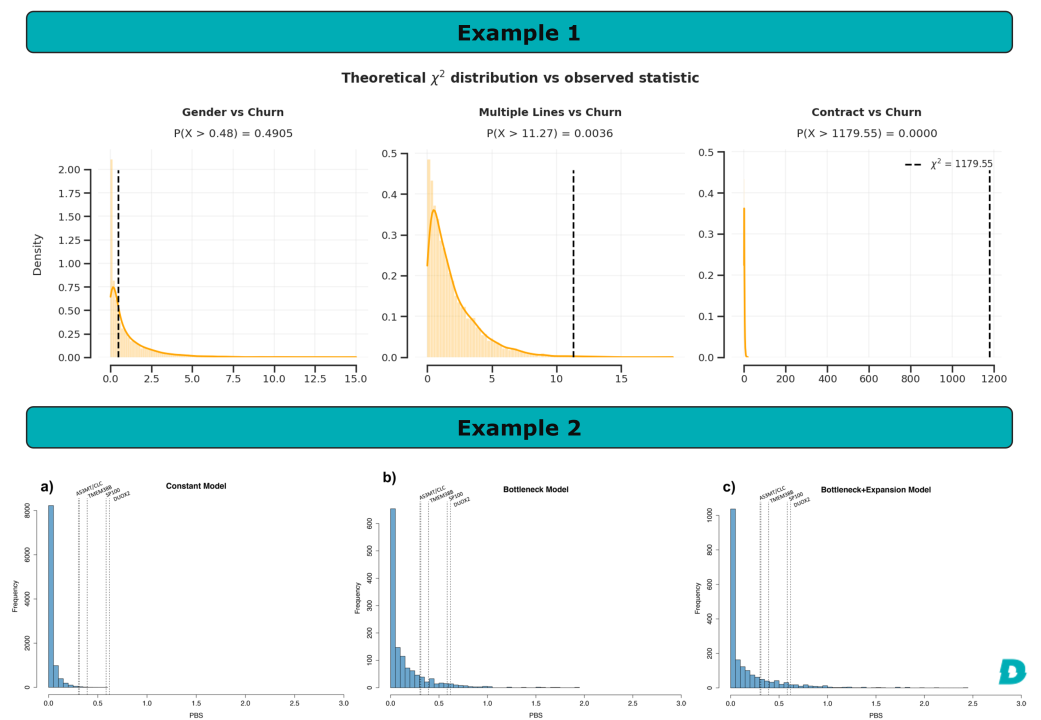
As part of my thesis in Data Science & Analytics at MBA USP/Esalq , I developed a hybrid model for churn prediction and prevention (a pipeline that returns the customer segment and their predicted churn probability). In the exploratory data analysis, I studied the relationship of the categorical features with the target variable (churn) by applying the chi-square test for each feature vs churn (h0 = the variables are independent). It returns the chi-square and the p-value, which is an excellent insight.
However, to go further and provide a visualization of the magnitude between the observed value and what would be expected by chance, I performed simulations of the expected chi-square values for each feature-target combination, and then I plotted the distribution along with a dashed vertical line to indicate the observed value and its respective p-value.
In the figure of example 1, we can observe the distribution of the expected values vs observed for three variables. We can see that the observed value in the first variable falls well within the expected distribution, so the p-value is not significant. In the second variable, the expected value falls a bit distant, resulting in a significant p-value, but still not a huge difference lol. In the third variable, the discrepancy between the expected and observed values is notorious. Therefore, this is a variable that we cannot fail to include in the model ;)
Example 2: Identification of genes responsible for the adaptive process
As part of my doctorate in genetics and evolutionary biology at the Instituto de Biociências - IB / USP , I used simulations to identify signs of natural selection in Native American populations. First, we identified possible genetic variants responsible for the adaptation process in extreme environments, such as in the regions of extreme altitude in the Andes. After that, we used programs developed by mathematicians and geneticists to perform numerous simulations of what the expected frequency of these genetic variants would be in a neutral scenario (i.e., chance). We then compared the distribution of expected values in different scenarios with the observed values, computing the p-value to validate our hypothesis.
Both cases show how simulations and statistical analyses can enrich our data projects, helping us to validate hypotheses and discover valuable insights ??
?? What about you? Have you explored these tools in your projects? Share your experience in the comments!
#datascience #datamining #dataanalytics #statistics #genetics #bioinformatics