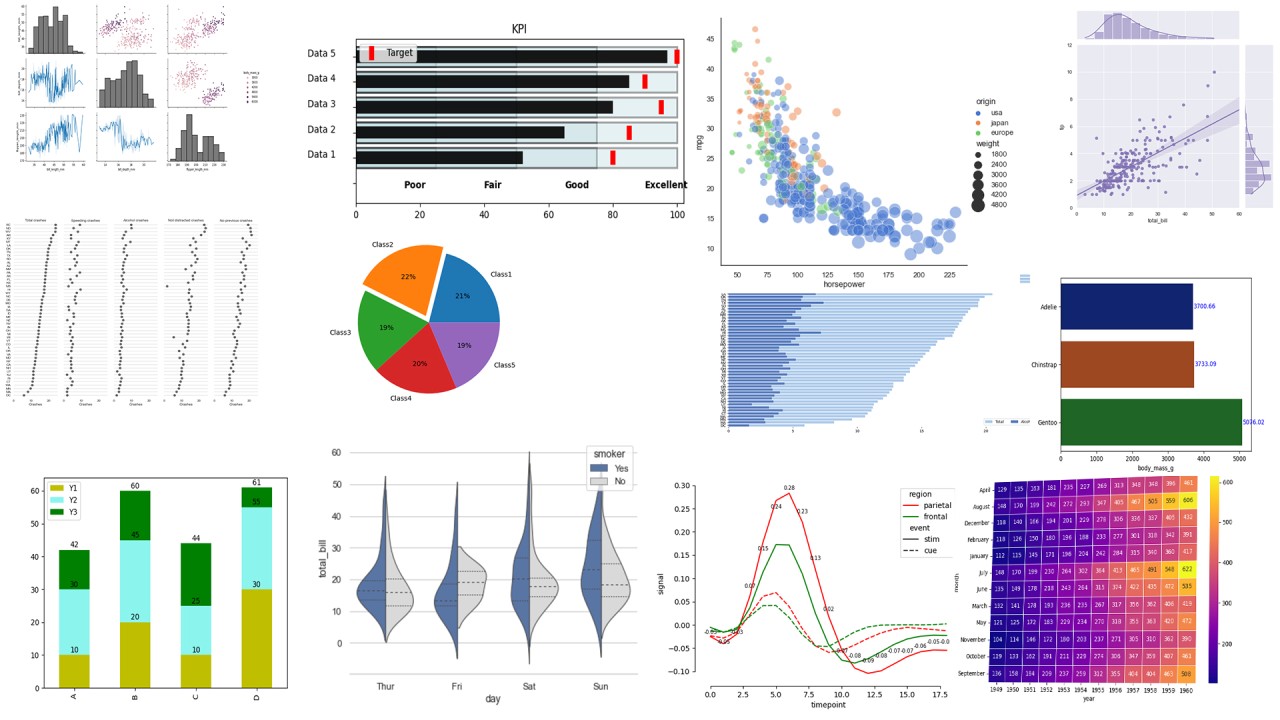
Python (Seaborn) Charts:
for who are interested in Data science and analysis, I have put 17 important charts under one class with Label values.
very easy and quick to use and customized:
Charts includes:
1-Bullet Chart
2- Bar Charts
3-Pie Charts
4- Line Charts
5- Line Charts
6- LM charts
7-Heatmap
8- Box plot
9- Violin Chart
10- Scatter Chart
11-ECDE Chart
12-Stacked Bars
if you are interest, just comment and i will send .
Quantitative analyst / data scientist
3 个月Very useful class! Could you send me?