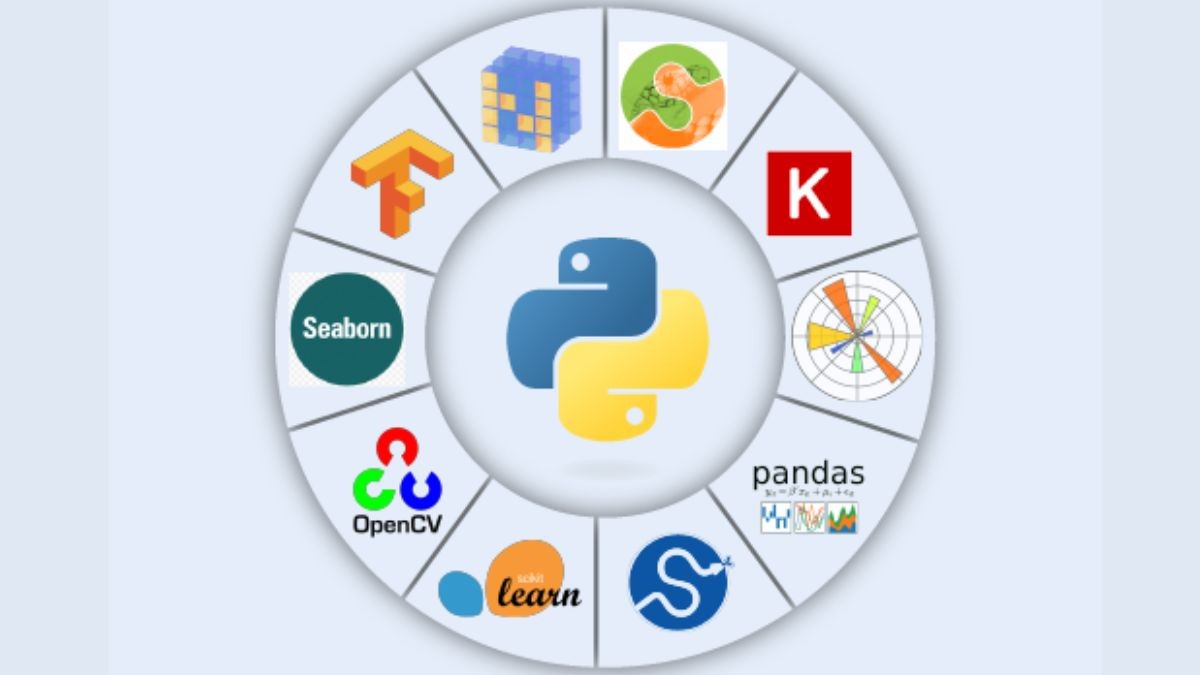
Certainly! Here's an overview of some key Python libraries for data analysis and their respective uses:
- Explanation: NumPy is the fundamental package for scientific computing with Python. It provides support for large, multi-dimensional arrays and matrices, along with mathematical functions to operate on these arrays.
- Use: Widely used for numerical operations, linear algebra, statistical analysis, and working with arrays.
- Explanation: Pandas is a powerful data manipulation and analysis library. It provides data structures like Series and DataFrame, making it easy to handle and analyze structured data.
- Use: Ideal for data cleaning, exploration, and analysis. Commonly used in data preprocessing and transformation tasks.
- Explanation: Matplotlib is a 2D plotting library for creating static, animated, and interactive visualizations in Python.
- Use: Essential for data visualization, allowing users to create a wide range of plots, charts, and graphs to understand and communicate data.
- Explanation: Seaborn is a statistical data visualization library based on Matplotlib. It provides a high-level interface for drawing attractive and informative statistical graphics.
- Use: Particularly useful for creating aesthetically pleasing statistical visualizations, often with less code than Matplotlib.
- Explanation: Scikit-learn is a machine learning library that provides simple and efficient tools for data mining and data analysis. It's built on NumPy, SciPy, and Matplotlib.
- Use: Widely used for machine learning tasks, including classification, regression, clustering, and dimensionality reduction.
- Explanation: Statsmodels is a library for estimating and testing statistical models. It supports various statistical models and hypothesis tests.
- Use: Useful for statistical analysis, hypothesis testing, and regression analysis. It complements Scikit-learn for more traditional statistical tasks.
- Explanation: SciPy is an open-source library for mathematics, science, and engineering. It builds on NumPy and provides additional functionality.
- Use: Includes modules for optimization, integration, interpolation, eigenvalue problems, signal and image processing, and more.
- Explanation: Plotly is an interactive plotting library that enables the creation of interactive plots and dashboards.
- Use: Ideal for creating web-based interactive visualizations. Supports a wide range of chart types and is often used for dashboard development.
9. TensorFlow and PyTorch:
- Explanation: TensorFlow and PyTorch are popular deep learning frameworks. They provide tools for building and training neural networks.
- Use: Essential for deep learning tasks such as image recognition, natural language processing, and other complex machine learning models.
These libraries collectively form a powerful ecosystem for data analysis and machine learning in Python, catering to various aspects of data manipulation, visualization, statistical analysis, and machine learning.
IT Support ||Data Science ALX Learner
5 个月very helpful..thanks