Pandas : Handling Data (DataFrame and Series)
Mohsin Khan
Energy Digital I Artificial Intelligence I Intelligent Automation | Digital Transformation | PMP?/SixSigmaBlackBelt
You have a big dataset ? looking to explore what the data is talking about ? Python Pandas library can help you.
Pandas help us transform the data (any kind of data) into series or DataFrame and that gives us an easy way of handling , manipulating and utilizing the data.
In the last article we discussed NumPy in details and in this one we are going to talk about another important library Pandas and its usage in data analysis and exploration.
Following topics are covered : Series/Dataframe/Handling Data operations/Functions/Sparkline/Basic operations like min/max/median/mean/datetime plus some other key topics
Why Pandas:
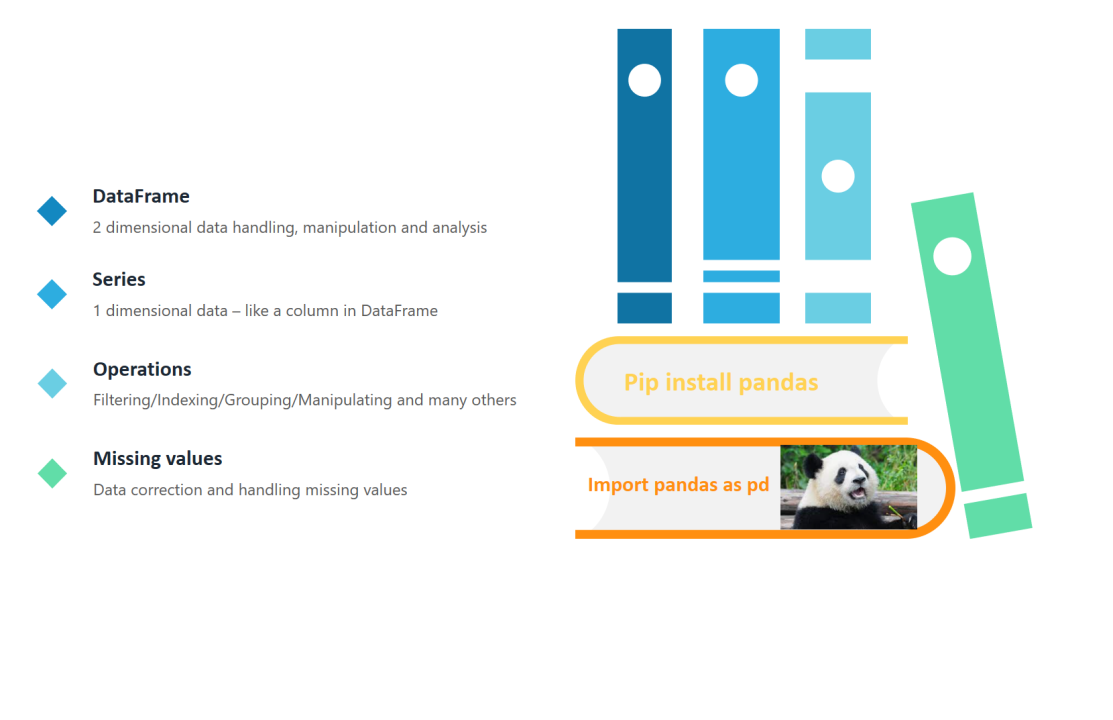
Pandas provides an efficient way to slice the data and flexibility to merge, concatenate and reshape the data. Pandas provide DataFrame structure which is a 2 dimensional data with labels, something similar to sql or excel but more powerful and flexible in many scenarios.
· Series : 1-dimensional array used to store any kind of data
· DataFrame : Think of it as collection of series and a 2 D sheet or table.
Pandas vs Numpy :
Pandas provide 1 dimension with series and 2 dimension with DataFrame but on the other hand Numpy can handle multi-dimensional array (ndarray). Numpy is also proven to be memory efficient and also scores better in terms of fast indexing
Install Pandas:
pip install pandas
Basic operations with Pandas:
Series
Creating 1 dimensional arrays
DataFrame
Creating a dataframe or collection of series (2 dimensional array)
Another way to use data from a location - Importing file from a location
Access single column
Applying operations on a specific column
Applying some basic functions like min/max/median/mean and other operations
Some good examples form LinkedIn Posts about using Pandas
Sparkline :
https://github.com/iiSeymour/sparkline-nb/blob/master/sparkline-nb.ipynb
Render sparkline style charts in pandas dataframes
Philip Vollet :
Handling Datetime and calculations
Khuyen Tran :
https://www.dhirubhai.net/feed/update/urn:li:activity:6798596663997997056/
Explore more : MultiIndex that allows working with higher dimension data by allowing to store and manipulate data with an arbitrary number of dimension to a lower dimension - Series or DataFrame
https://pandas.pydata.org/pandas-docs/stable/user_guide/advanced.html
Cheat Sheet
I hope this article provides a basic understanding of how pandas can help in different types of data operations.
Provide your feedback to improve further. Happy Learning !


Solution Expert(RPA/IPA)
3 年Thanks for sharing!
Energy Digital I Artificial Intelligence I Intelligent Automation | Digital Transformation | PMP?/SixSigmaBlackBelt
3 年https://www.dhirubhai.net/feed/update/urn:li:activity:6796323879590731777/?updateEntityUrn=urn%3Ali%3Afs_feedUpdate%3A%28V2%2Curn%3Ali%3Aactivity%3A6796323879590731777%29 Another great example : ?Read in a CSV using a URL - all in pandas!
IIM Kashipur MBA '25 ||Ex-TCS||Ex-Wipro||JMI 2020|| Six Sigma Green Belt || Microsoft AI 900
3 年????
AI & Business Automation Consultant | SaaS
3 年Thanks for sharing
Energy Digital I Artificial Intelligence I Intelligent Automation | Digital Transformation | PMP?/SixSigmaBlackBelt
3 年You can even read a CSV file in Google Drive or url https://www.dhirubhai.net/feed/update/urn:li:activity:6796323879590731777/?updateEntityUrn=urn%3Ali%3Afs_feedUpdate%3A%28V2%2Curn%3Ali%3Aactivity%3A6796323879590731777%29