MBES data processing challenges and Python
In the past several years, since I started to employ python scripts for MBES data processing, I faced many challenges and found several interesting solutions. Today I'd like to share it with others.
I can separate two main fields which I worked for: position and MRU artifacts.
MRU artifacts
Artifacts of MRU is quite common because not all people know how to set it up correctly. The effect varies from the little heave artifacts to the huge problems caused by absence of valid Pitch, Roll and Heave data. Over the past three years I was asked two times to solve this kind of problem where affect was serious. How to avoid such situation is the topic for separate article, which I can create if commenters will ask. But today I will share results of it's fixing with the scripts in case there is no possibility to solve problem with changing of the settings, offsets and time delays during the data processing.
I already explained the several scripts in previews articles and one of them was related to the MRU artifacts (“Heave and Roll artifacts correction with python”). It was quite simple case where we had very flat seabed and it was possible to use described method. Two weeks after posting of that article I’ve got request from one company to fix their data with same problem and the rough relief. I was about reject this challenge, as the task seemed impossible, but mi mind was suddenly quick to give me a solution. The idea was to make the smoothed surface and then adjust the raw data to match it but without of losing the relief. It’s possible if corrections calculated for each ping profile between the smoothed surface and its polynomial regression model of defined order built for this ping. After couple days of experiments, I found optimal order and got unexpectedly good results. I reduced artifacts of ROLL, Heave and SVP so much so, data looked like were surveyed with system which was sated up properly.
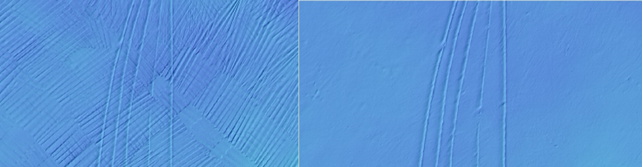
Later I’ve got another offer – the data set was collected with two MRUs and both of them shown strange pith, roll, heave values. They didn’t match and, also both were wrong. It was nothing to do with Qimera – data from MRUs were completely wrong. Seabed was flat but there were objects. Again, I was about to reject the challenge, but decided to see what can I do. Finally, I found original solution – I removed all objects from the seabed and then smoothed it and it was my reference for data matching. The pictures of three surfaces presented below:
Positioning
If the MBE installed on the boat with GNSS receiver most probable you will have no problems with position but when the survey is performing from ROV or AUV we have to use the underwater position systems. Its position quality reducing dramatically with increasing of the water depth. The INS systems help with smoothing of the position but have the effect of the position drift across track and position stretching/compressing along the track. It’s not a big problem if you have to process just one pass over the pipeline in one direction, especially if DVL didn’t get crazy from pipeline.
Another situation if DVL shows wrong values because of its installation position and INS starting to drift from side to side. And it’s even more difficult when You need to process the two or more overlapping survey lines with rough relief or/and existing objects where positioning was not perfect. In this case effects of the drift and stretching/compression will cause serious problems.
During past years usage of the ROVs and AUVs only increasing and I faced all troubles mentioned above. Usually, we were able to reduce it with proper setup and equipment calibration or with conventional data processing techniques, but not in any cases.
I developed several algorithms to match the overlapping ROV/AUV data or one pass data with very strong drifting affects.
Positioning algorithm 1.
It’s useful when you need to match overlapping ROV/AUV data affected by the nav problems, collected over the rough relief area or over the trench with rough edges. It takes one file and starting loop trough the pings. Script finds optimal shifts for each portion of pings to have the minimal discrepancy with reference file. There is option to match overlapping files toward each other. This algorithm works fine if relief is rough enough as I already said otherwise script will have no solution. It saved me a lot of time on one project where we were monitoring the trenching by the ROV. We did several parallel passes to cover the wide trench and we had position drifting about 1 m. between the lines averagely. It was impossible to get proper solid surface where the data were not matching because of the position discrepancies.? Unfortunately, I have no pictures and data from that project any more, but I still have the script.
领英推荐
Positioning algorithm 2.
It’s useful when you need to match overlapping ROV/AUV data affected by the nav problems, collected in the flat relief area with presented objects. In this case I didn’t find adequate method for automatic statistical shifting. I found it’s useful to pick the remarkable objects from both lines in the same order. In this case we have two sets of points with same quantities of the points to match.
The white line is picked on one file and green on the second, the blue line shaws average position between remarkable points for each pair. The script merges the picked lines with MBES data by the coordinates and calculates the position corrections to the ping or time of the MBES file. The corrections between the points are interpolating which makes shifts smoothed.
This method takes a lot of the handwork, but allows to match data which impossible to fix with conventional data processing methods.
Positioning algorithm 3.
In case You have the ROV/AUV data over pipeline and it looks like the snake this method can help you. I faced this case when our DVL was installed in the middle of the ROV and ROV had to fly along pipeline with low altitude because of the poor visibility. DVL was getting wrong speed and directional angle because of the pipeline underneath of it and we had no chance to change it due to the luck of time.
To fix this problem I have digitised and smoothed the pipe line. Then the script was detecting the top of pipe for the stack of the several pings and moving it towards smoothed pipeline route. It’s seems like the matchup function in Navimodel, but works faster and automated. It allows me to matchup 20 km of the pipeline data within 2 hours. However, it needs the correct setup, sometimes I need to run one data file through the script 2-5 times to get good results, sometimes it works perfect for many kilometres. The example of its work is presented on the picture bellow. In that area we had almost no reliable USBL position because of the shallow water (it would be better to use the boat).
On the picture bellow the processing results where the script was adopted to match post trenching data set to the pre trenching survey:
Conclusion.
I think data processing software should follow the trends and move towards the automatization. The amount of the data increasing, same time we are facing new realities with data collected by AUVs and ROVs .? Maybe it’s time to develop something new which allow the users to fix above problems with the data and same time keep the track of all changes to present the real errors budget to client.
I’m ready to help anyone who face troubles with data processing, or with project planning to avoid such situations. Also, I’m interested in cooperation with software developers who want to employ new approach for data processing.
Good luck to all and with the best regards.
Dataprocessor Multibeam - Sidescansonar / Gis Charitng
5 个月Really interesting expecially for AUV and Rov data.. can you share some exmple dataset with script
Awesome! ?? What data formats are you working with?
Senior Multibeam Processor
1 年Very good!
Marine geologist with experience in ocean mapping (bathymetry and GIS)
1 年Thanks for sharing! MB-System includes a solution similar to your "Positioning algorithms" - in case this might be helpful. https://www3.mbari.org/products/mbsystem/html/mbnavadjust.html
Hydrographic Senior Software Engineer at QPS B.V.
1 年"allow the users to fix above problems with the data and same time keep the track of all changes to present the real errors budget to client." I'm really happy to see this sentiment catching on more in offshore surveying. The toolset we've developed so far in Qimera really focuses on documenting positioning changes as a processing setting, so it is easy to audit or remove at any point. We haven't used it to inform TPU, yet, mostly because there is no accepted industry standard for that, but I'm very curious about any thoughts on that.