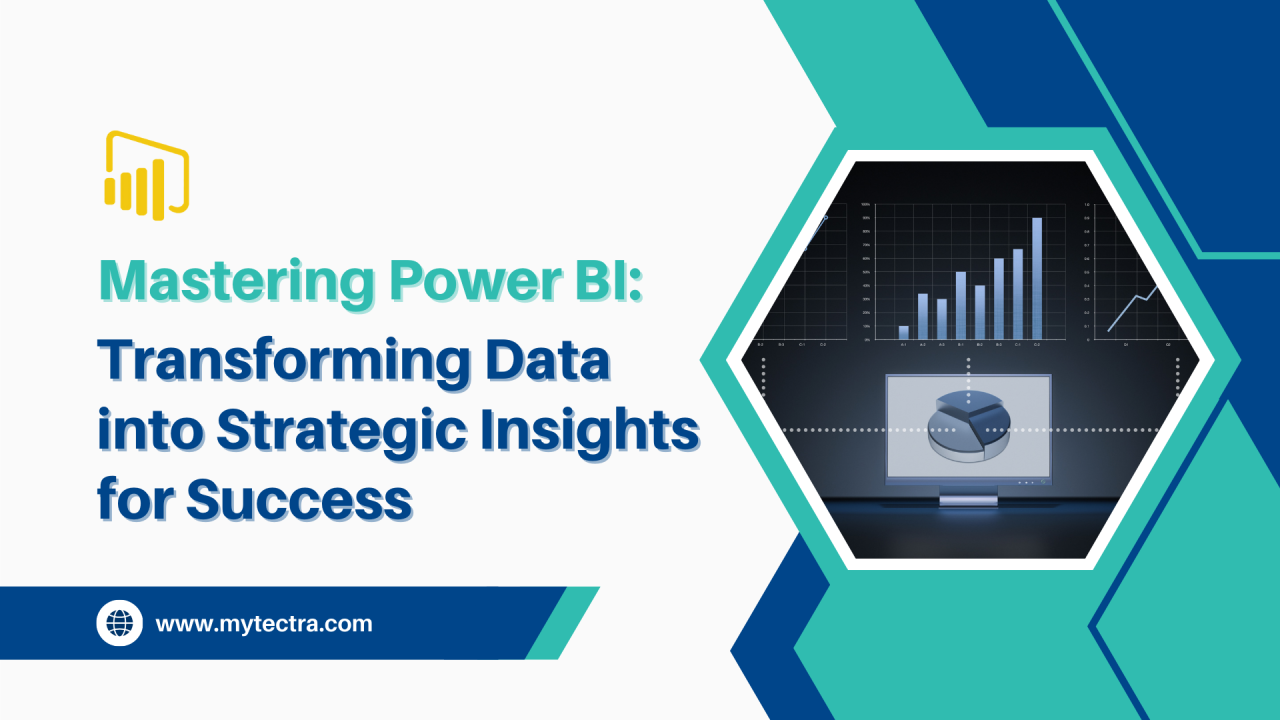
Mastering Power BI: Transforming Data into Strategic Insights for Success
What is Power BI?
Power BI is a business analytics tool from Microsoft designed to help organizations visualize their data, share insights, and make data-driven decisions. With its user-friendly interface, Power BI transforms raw data into interactive dashboards and reports, making it accessible to a wide range of users—from business analysts to executives. Integrated within the Microsoft ecosystem, it offers robust connectivity to various data sources, enabling comprehensive data analysis and real-time reporting.
The Evolution of Business Intelligence
Business intelligence (BI) has evolved significantly over the past few decades. Traditional BI solutions often involved complex processes requiring specialized skills to extract insights from data. However, with advancements in technology and the rise of self-service BI tools like Power BI, businesses can now empower users at all levels to analyze data independently. This shift democratizes data access, fostering a culture of data-driven decision-making.
Importance of Data Visualization
Data visualization is crucial in understanding complex data sets. Effective visualizations help to identify trends, patterns, and outliers quickly, allowing for timely decision-making. Power BI’s interactive visuals facilitate deeper insights into data, making it easier for users to derive meaningful conclusions from their analyses.
Key Features of Power BI
1. Data Connectivity
Power BI boasts an extensive range of connectivity options, allowing users to integrate data from various sources. Whether it's Excel spreadsheets, SQL databases, cloud services like Azure and Salesforce, or even custom APIs, Power BI can pull data from multiple platforms seamlessly. This flexibility is essential for organizations that rely on diverse data sets.
2. Interactive Dashboards
Power BI enables users to create visually appealing and interactive dashboards that provide a comprehensive view of key metrics and insights. Users can customize their dashboards by selecting relevant visuals, filtering data, and drilling down into specifics to better understand their data.
3. Data Transformation
Power Query, a powerful data transformation tool integrated into Power BI, allows users to clean, transform, and model data without extensive coding knowledge. Users can merge datasets, remove duplicates, and create calculated columns, ensuring that the data is accurate and ready for analysis.
4. Advanced Analytics
Power BI includes advanced analytical capabilities, such as DAX (Data Analysis Expressions) for performing complex calculations and aggregations. Additionally, built-in AI features help users uncover trends and make predictions based on historical data, enhancing their analytical capabilities.
5. Collaboration and Sharing
Collaboration is made easy with Power BI. Users can share reports and dashboards with team members and stakeholders through the Power BI Service, ensuring everyone has access to the same insights. This fosters teamwork and informed decision-making across departments.
6. Mobile Access
Power BI offers a mobile app that enables users to access their reports and dashboards on-the-go. This mobility ensures that decision-makers can stay informed and responsive, no matter where they are.
Power BI Use Cases
Power BI is utilized across various industries for diverse applications, enhancing decision-making and driving business growth. Below are some key use cases that illustrate its versatility:
1. Sales Performance Tracking
Power BI is commonly used in sales to analyze performance metrics. Organizations can track sales figures across different regions, products, and time periods. For instance, a retail company might utilize Power BI to visualize sales data, allowing management to identify high-performing stores and optimize inventory based on sales trends.
2. Financial Reporting
In the financial sector, Power BI plays a crucial role in real-time financial reporting. Financial institutions can create dashboards that display key performance indicators (KPIs) such as revenue, expenses, and profit margins. By having up-to-date financial insights, executives can make informed investment decisions.
3. Marketing Analytics
Marketing professionals leverage Power BI to measure the performance of campaigns across various channels. By consolidating data from social media, email, and web analytics, marketers can visualize engagement metrics and optimize their strategies based on real-time data.
4. Customer Insights
E-commerce businesses use Power BI to analyze customer behavior, helping them deliver personalized marketing experiences. By understanding customer preferences and purchasing patterns, organizations can tailor their offerings to meet specific needs.
5. Operations Management
Manufacturers employ Power BI to monitor production efficiency and identify bottlenecks in their operations. By visualizing key operational metrics, organizations can enhance their productivity and streamline resource allocation.
6. HR Analytics
Human resources departments utilize Power BI to track employee performance metrics, turnover rates, and engagement scores. This data-driven approach aids in workforce management and strategic planning, ensuring that organizations retain top talent.
7. Supply Chain Management
Power BI assists logistics companies in visualizing shipment data, allowing for better management of delivery schedules and resources. By analyzing supply chain metrics, organizations can optimize routes and improve delivery times.
8. Healthcare Analytics
Healthcare providers use Power BI to analyze patient data and treatment outcomes. By visualizing patient demographics, treatment success rates, and resource allocation, healthcare organizations can make better decisions to enhance patient care.
9. Project Management
Project management teams benefit from Power BI by tracking project timelines, budgets, and resource allocation. By visualizing these metrics, teams can ensure that projects stay on track and within budget.
10. Local Government Reporting
Local governments utilize Power BI to manage and visualize data related to public services. By making data transparent, municipalities can enhance community engagement and ensure accountability.
Top Companies Using Power BI
Power BI is trusted by numerous organizations globally to enhance their data analytics capabilities. Some of the top companies using Power BI include:
1. Coca-Cola
Industry: Beverages
Use Case: Coca-Cola employs Power BI to manage its vast digital content across various countries and regions, maintaining brand consistency while delivering personalized experiences based on location and customer preferences.
2. Heathrow Airport
Industry: Transportation
Use Case: Heathrow uses Power BI to analyze passenger flow data, optimizing airport operations and improving customer experience.
3. Nestlé
Industry: Consumer Goods
Use Case: Nestlé leverages Power BI for real-time supply chain analytics, enhancing operational efficiency and decision-making.
4. Microsoft
Industry: Technology
Use Case: Microsoft uses Power BI internally to analyze business performance and inform strategy across its various divisions.
5. Dell
Industry: Technology & Electronics
Use Case: Dell employs Power BI to track sales performance and customer insights, driving targeted marketing strategies.
6. Walmart
Industry: Retail
Use Case: Walmart uses Power BI to visualize inventory levels and sales data, enabling data-driven supply chain decisions.
领英推荐
7. Adobe
Industry: Software
Use Case: Adobe utilizes Power BI for product performance tracking and customer feedback analysis.
8. Ford
Industry: Automotive
Use Case: Ford uses Power BI to analyze production data, enhancing efficiency and quality control in manufacturing processes.
9. T-Mobile
Industry: Telecommunications
Use Case: T-Mobile leverages Power BI to manage its digital content, ensuring users across different regions have access to relevant information about plans, devices, and promotions.
10. Nike
Industry: Sportswear & Apparel
Use Case: Nike employs Power BI for real-time performance tracking of marketing campaigns and product sales.
Who Can Do a Power BI Course?
A Power BI course is suitable for a diverse range of professionals looking to enhance their data analysis and visualization skills. Here’s a breakdown of who can benefit from a Power BI course:
1. Business Analysts
Who it’s for: Professionals responsible for analyzing business data and providing actionable insights. Why: Power BI enhances their ability to visualize and report data effectively, leading to better strategic decisions.
2. Data Analysts
Who it’s for: Analysts who work with data to identify trends and patterns. Why: Power BI offers advanced analytical tools for better data exploration and visualization, allowing analysts to derive meaningful insights.
3. Marketing Professionals
Who it’s for: Marketers looking to measure campaign performance and customer engagement. Why: Learning Power BI helps them create insightful reports for decision-making, improving the effectiveness of marketing strategies.
4. Finance Professionals
Who it’s for: Financial analysts and accountants. Why: Power BI assists in creating real-time financial reports and forecasts, aiding in financial planning and analysis.
5. IT Professionals
Who it’s for: IT specialists involved in data management and reporting. Why: Power BI can improve reporting processes and data integration, ensuring accurate and timely insights for stakeholders.
6. Executives and Managers
Who it’s for: Leaders who need to make informed decisions based on data insights. Why: Power BI helps in visualizing key metrics for better strategic planning and performance monitoring.
7. Students and Fresh Graduates
Who it’s for: Individuals seeking to enhance their data analytics skills. Why: Learning Power BI can give them a competitive edge in the job market, as businesses increasingly seek data-driven professionals.
Career Opportunities in Power BI
As organizations increasingly rely on data-driven decision-making, the demand for Power BI skills continues to grow. Here are key career opportunities available for those skilled in Power BI:
1. Power BI Developer
Role Overview: Develops and maintains Power BI reports and dashboards, ensuring they meet business needs. Required Skills: Proficiency in DAX, Power Query, data modeling, and experience with data visualization principles.
2. Data Analyst
Role Overview: Analyzes data and creates reports using Power BI, providing insights to support business decisions. Required Skills: Strong analytical skills, knowledge of SQL, and experience with Power BI and data visualization techniques.
3. Business Intelligence (BI) Analyst
Role Overview: Works with business units to gather requirements and develop BI solutions that drive strategic initiatives. Required Skills: Experience with BI tools, data visualization, and strong communication skills to liaise with stakeholders.
4. Power BI Consultant
Role Overview: Provides expertise and guidance on implementing Power BI solutions for organizations, ensuring best practices are followed. Required Skills: In-depth knowledge of Power BI features, data integration techniques, and analytical thinking.
5. Financial Analyst
Role Overview: Utilizes Power BI for financial reporting and analysis, helping organizations track performance and forecast future trends. Required Skills: Strong financial acumen, experience with Excel and financial modeling, and proficiency in BI tools.
6. Marketing Analyst
Role Overview: Analyzes marketing data using Power BI to improve campaigns and track performance metrics. Required Skills: Understanding of digital marketing metrics, data visualization techniques, and strong analytical abilities.
Salary Packages for Power BI Professionals
Salaries for Power BI professionals can vary based on experience, role, and location. Here are average salary ranges based on roles:
●???? Power BI Developer: $80,000 - $120,000 per year
●???? Data Analyst: $65,000 - $100,000 per year
●???? Business Intelligence (BI) Analyst: $70,000 - $110,000 per year
●???? Power BI Consultant: $90,000 - $130,000 per year
●???? Financial Analyst: $70,000 - $100,000 per year
●???? Marketing Analyst: $60,000 - $90,000 per year
Factors Influencing Salary
Several factors influence salary levels, including:
1.??? Experience: More experienced professionals generally command higher salaries.
2.??? Industry: Salaries can vary widely across industries, with technology and finance often offering the highest compensation.
3.??? Location: Geographical location can significantly impact salary levels, with urban centers typically offering higher salaries to offset living costs.
4.??? Certifications: Holding relevant certifications, such as Microsoft Certified: Data Analyst Associate, can enhance earning potential.
Conclusion
Power BI is an essential tool for professionals looking to harness the power of data analytics and visualization. As organizations prioritize data-driven strategies, the demand for Power BI skills will continue to rise. Pursuing Power BI training can position you in a lucrative career path, whether you're a developer, analyst, or marketer. With its robust features and user-friendly interface, Power BI offers an excellent opportunity to enhance your career in the ever-evolving field of data analytics.
By mastering Power BI, professionals can unlock the potential of their data, drive better business outcomes, and remain competitive in the fast-paced job market. Whether you're just starting or looking to advance your career, Power BI is a valuable skill that can lead to numerous opportunities in the data-driven landscape of today’s business world.