Mastering Power BI: Keeping Your Card Visuals Static When Applying Filters.
?????????? ?????? ???????? ???????????? ???? ???????? ???????? ???????? ?????????????? ???? ?????????? ???? ??????????????????, ???????? ???????? ???????????????? ?????????????? ???? ??????????????? ???????? ???????????? ?????? ???????????????? ?????????? ?????? ???????? ???????? ?????????????? ???????? ?????????????? ?????? ????????????????????!
?? ?????? ???? ???? ????:
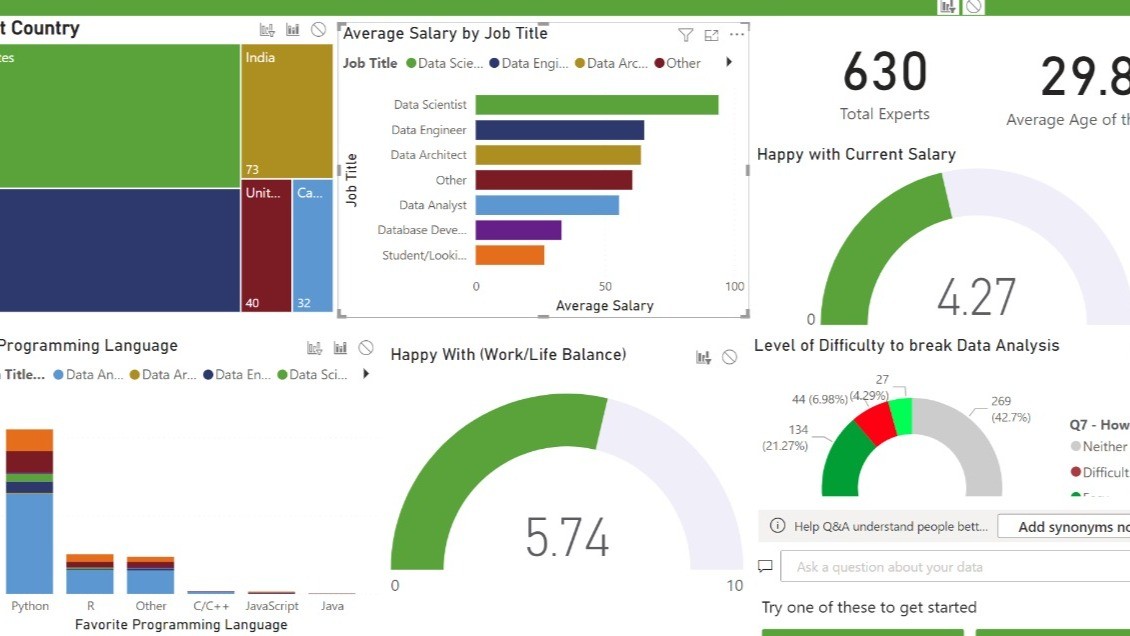
1. ???????????? ???????? ???????????? ???? ????????????: Start by clicking on the slicer or filter that you want to use in your report.
2. ???????????? ???????? ????????????????????????: Head over to the "Format" tab and click on "Edit interactions." This feature allows you to control how filters affect each visual on your report.
3. ???????????? ???????? ????????????????????????: For each card visual you want to remain static, select the "No Impact" option (the small circle with a line through it). This ensures that the filter won’t change the card’s data.
?? ?????? ???????? ??????????????:
? ???????????????? ??????????????: Customize your report to show consistent key metrics on cards while allowing other visuals to change dynamically.
? ?????????????? ????????????????: Keep your essential KPIs front and center without distractions from applied filters.
By leveraging this trick, you can create more insightful and controlled Power BI reports. It’s all about making your data work for you!
#PowerBI #DataVisualization #DataAnalytics #BusinessIntelligence #MicrosoftPowerBI
I help Data Professionals sign clients through LinkedIn | From Data Professional myself → to Lead Gen Expert for Data professionals | DM me "CLIENTS" to get started
7 个月Thank you for sharing this valuable tip. Keeping key metrics consistent is a game changer for cleaner insights.