Mastering Data Preparation Techniques with Amazon SageMaker Data Wrangler
Data & Analytics
Expert Dialogues & Insights in Data & Analytics — Uncover industry insights on our Blog.
Explore the transformative power of Amazon SageMaker Data Wrangler in streamlining your data preparation processes for machine learning projects. Learn to load, transform, and export datasets efficiently, allowing you to focus on what matters—building impactful models! - Mirko Peters
Have you ever stared at a raw dataset, feeling both intrigued and overwhelmed, wondering where on earth to start? I vividly recall my early days as a data scientist, wrestling with messy spreadsheets and convoluted data formats. What if I told you there's a way to transform this daunting task into a seamless experience? Enter Amazon SageMaker Data Wrangler—a tool that turns the data preparation process from chore into a creative adventure. In this post, we're unraveling the mystery of data prep, guiding you through a hands-on journey in Amazon SageMaker that will leave you feeling empowered and ready to tackle any dataset.
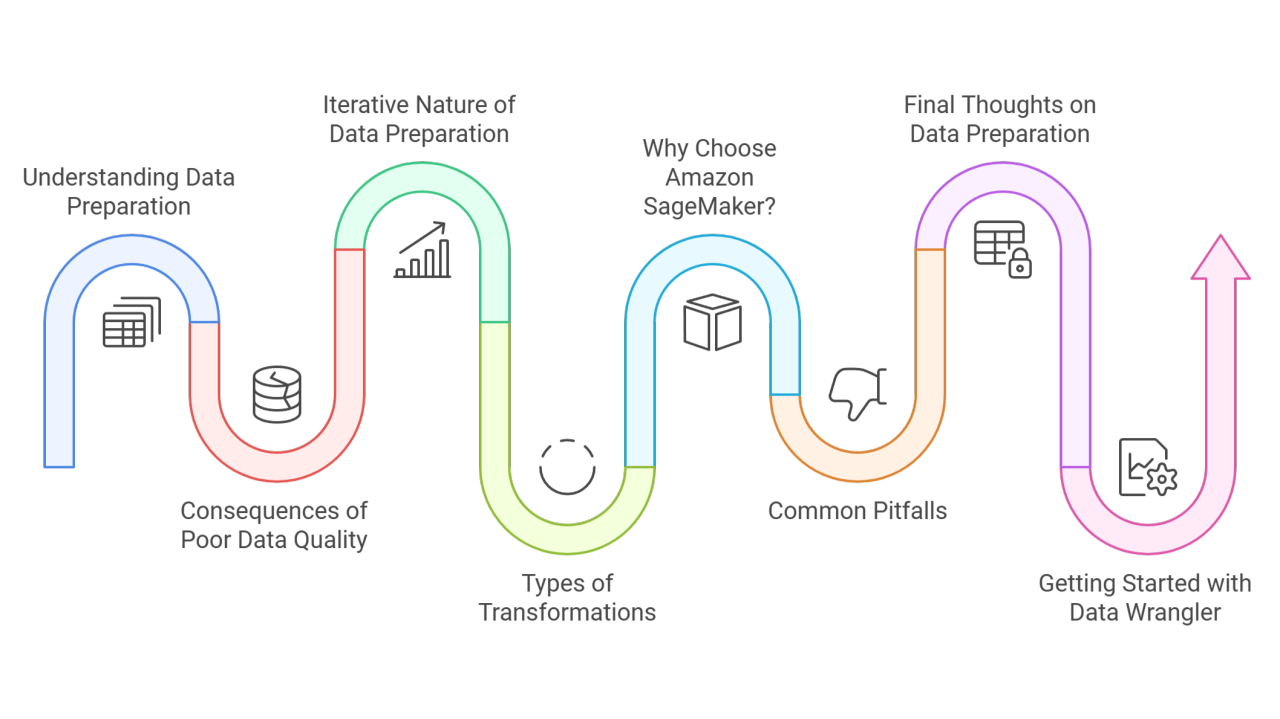
Understanding the Importance of Data Preparation
Have you ever thought about what makes machine learning projects successful? It’s often not the algorithms or the complexity of the models—they can be simply amazing. But the real hero behind the scenes is something less glamorous: data preparation.
Data Preparation as the Foundation of Machine Learning
Data preparation is the backbone of any machine learning project. It involves cleaning, transforming, and organizing raw data into a format that can be effectively analyzed. Think of it like cooking. You can have the finest ingredients (data), but if you don’t prepare them right, the dish (your model) won’t come out as expected. Properly prepared data leads to better insights and more accurate models.
Consequences of Poor Data Quality
Now, let’s explore the downside. What happens if you neglect data quality? Let me tell you—it can be disastrous. Imagine building a beautiful house on a shaky foundation. That it's likely to collapse sooner or later, right? Statistics show that poor data quality can lead to a 30% increase in costs and a significant decline in performance. Your model might yield inaccurate predictions, leading you to make wrong business decisions. A staggering thought, isn’t it?
The Iterative Nature of Data Preparation
One of the key aspects of data preparation is that it’s not a one-and-done process. It’s iterative. You might have to repeat the steps several times to achieve the desired quality. Each iteration lets you learn more about your data. You try different transformations and tweaks, and with each cycle, you get closer to perfection. This learning process is essential for refining your models.
Types of Transformations Commonly Used
So, what kind of transformations do we actually perform? Here’s a quick list:
These transformations are critical. They help improve model accuracy and efficiency.
Why Amazon SageMaker?
You might wonder, why should you consider Amazon SageMaker for data preparation? The answer is simple: it provides powerful tools to streamline the process. With tools like Amazon SageMaker Data Wrangler, you can automate many of the repetitive tasks involved in data preparation. It supports various transformation techniques and helps you visualize your data seamlessly.
In fact, Mirko Peters aptly summarizes it well:
“Good data preparation can make or break your machine learning project.”
Common Pitfalls in Data Preparation Processes
While preparing your data, it’s easy to fall into certain traps. Here are some pitfalls to watch out for:
Remember, the quality of your model is often only as good as the data that feeds it. In the quest for accuracy, don’t overlook these common pitfalls.
Final Thoughts
Data preparation isn’t just a step in machine learning; it’s the foundation that supports your entire project. By investing time and effort in preparing your data, you’re setting yourself up for success. Whether using Amazon SageMaker or any other tool, prioritizing data quality is your first step towards creating impactful machine learning models.
Getting Started with Amazon SageMaker Data Wrangler
Overview of Amazon SageMaker Data Wrangler
Have you ever felt overwhelmed by data preparation tasks? Amazon SageMaker Data Wrangler might just be the solution you need. This powerful tool simplifies the process of transforming and preparing data for machine learning projects. By providing an intuitive graphical interface, it allows you to perform data preparation steps without requiring advanced coding skills. As Michael Pendleton puts it,
“Data Wrangler makes complex tasks feel simple and approachable.”
Setting Up Your SageMaker Environment
Before jumping into the exciting world of Data Wrangler, you need to set up your SageMaker environment. Here’s how:
Setting it up correctly is crucial for a seamless experience. Utilize the included screenshots in the notes section for visual guidance!
How to Load Datasets into Data Wrangler
Loading datasets into Data Wrangler is your next step. To begin, you’ll need some data. You can use various sources, but for this example, let’s work with the direct marketing dataset. Here’s how to get it:
Once the data is uploaded, go to your SageMaker Studio and create a new Data Wrangler flow.
Exploring the User Interface
When you open Data Wrangler, the interface is straightforward. At the top, you'll find options to add data sources. You can import from S3, Athena, or Redshift. Once you select your dataset, a clear preview emerges, allowing you to analyze your data structure right off the bat. It’s designed to give you insight into your data without feeling daunting.
Check out the available tools. You'll find features to visualize data distributions, relationships, and much more! Data Wrangler helps you navigate through these operations seamlessly.
Tips for First-Time Users
These tips can pave the way for a smoother learning experience. Remember, practice is key.
Conclusion
With Amazon SageMaker Data Wrangler, preparing data for your machine learning journey doesn’t need to be tedious. By utilizing its intuitive user interface, you can transform your datasets with ease and clarity. Enjoy exploring and making the most of your new tool!
Loading and Previewing Your Dataset
In the world of data science, the first steps in your project are crucial. You're probably asking, "How do I get started with my dataset?" Let's explore how to load and preview it effectively. We'll focus on a direct marketing dataset to learn how to use Amazon SageMaker Data Wrangler.
1. Choosing the Right Dataset for Practice
The dataset you choose determines the quality of your practice. You want something that's rich in features and provides real-world insights. The direct marketing dataset we’re using contains data that represents customers and their responses to marketing offers. This dataset will help you hone your skills in a practical scenario.
2. Steps to Load Datasets via AWS CLI
Ready to load your dataset? Follow these steps:
3. Understanding the Data Structure of the Loaded Dataset
What can you expect from this dataset? It contains 41,000 customer samples. Each sample includes various features like age, job, and whether they accepted marketing offers. The labels indicating responses (yes or no) are located in the 'y' column. Understanding this structure is key to effective data manipulation.
4. Reviewing Data Previews in Data Wrangler
Once you’ve got your data in your bucket, head to SageMaker Studio. Here’s how you preview your loaded dataset:
You'll see a preview of your dataset. This preview is vital for examining the data quality and formatting. You might be wondering, how can I tell if my data is ready for analysis? Well, that brings us to our next point...
5. Key Metrics to Consider During Review
When reviewing your dataset, consider these key metrics:
This hands-on approach helps ensure you catch potential issues before moving forward. The next step is to understand the insights your data can provide. The better you know your dataset, the more effectively you can prepare and model it.
By keeping these elements in mind, you're setting a solid foundation for your work with data. Remember, a well-prepared dataset can make all the difference in achieving accurate predictions and insights down the road.
Transforming Your Data: A Hands-On Approach
Data transformation is essential in preparing datasets for analysis or machine learning tasks. But what exactly does it entail? In essence, transforming data means altering it to improve its quality and usability. One powerful tool for this task is Amazon SageMaker Data Wrangler.
Common Transformations Available in Data Wrangler
Data Wrangler offers a variety of built-in transformations to help you optimize your datasets. Are you unsure where to start? Here are some common transformations that you can apply:
These options make it easier for you to handle different data scenarios. You can experiment with each transformation to see how they improve your dataset. You'll find that often, a combination of transformations yields the best results.
Utilizing Visualizations for Data Insights
Visual analysis is another powerful feature of Data Wrangler. Why is visualization so important? Well, it helps to reveal patterns, trends, and anomalies in your data. Here’s how you can leverage visualizations:
By visualizing your data, you're not just crunching numbers. You’re uncovering stories hidden within your dataset. Wouldn’t it be nice to see those trends come to life?
领英推荐
Adding Your Own Transformations
Data Wrangler doesn’t just limit you to built-in transformations. You can add your own, which gives you full control over how your data is handled. But how do you go about that?
It’s simple! You can use code snippets in Python or PySpark to apply custom transformations. For example, do you need to replace dots in column names with underscores? A quick custom transformation can achieve that!
Managing Columns and Data Types
Managing your columns and their types is crucial for effective data preprocessing. Have you ever faced issues where the data types of your columns were detected incorrectly? Don’t worry! You can easily correct them in Data Wrangler. Here’s what you can do:
These steps help maintain a structured approach, making your model training smoother. You wouldn’t want to waste time on unnecessary columns, right?
Iterative Improvement Through Transformations
One of the best aspects of using Data Wrangler is the ability to iterate. How does it work? You can continuously refine your transformations based on the results you see. For instance, after applying transformations, you might run a quick model to see how the changes impact performance.
With each iteration, you gain insights into what works and what doesn’t. So, keep experimenting! The journey of data transformation is exciting, and there's always something new to learn.
Example Transformations Applied to the Dataset
Let’s consider a practical scenario. For example, you have a dataset that includes customer profiles for a marketing campaign. You notice some irrelevant columns based on visual analysis, such as "day of week" or "marital status." You can drop those columns swiftly using the management tools in Data Wrangler.
Prefer to scale your numerical features? You can apply a normalization transformation to ensure uniformity. This is especially helpful when features have vastly different scales. Simple adjustments often lead to significant improvements!
Lastly, using Data Wrangler provides a seamless experience. With numerous built-in transforms available at your fingertips, managing and enhancing your datasets becomes not just manageable, but also enjoyable.
Analyzing Data Quality: Visualizations and Reporting
Understanding Your Dataset Through Visualization
When working with data, simply looking at numbers can be overwhelming. Have you ever stared at a huge spreadsheet and wondered, “What am I even looking at?” This is where visualizations come to the rescue! They turn complex data into simple, digestible graphics. By using visual tools, you can identify trends, patterns, and anomalies that might not be obvious in raw data.
For example, scatter plots can reveal correlations between variables, while histograms can show the distribution of data. With a clear visual representation, you can better grasp the story your data is telling.
Exploring Report Types in Data Wrangler
Data Wrangler offers various report types that can help streamline your data analysis process. Here are a few key reports you might find useful:
Using these different reports allows you to uncover insights that can directly influence your data processing decisions.
Identifying Data Leaks and Their Implications
Data leaks can be sneaky, undermining the integrity of your analysis. Imagine pouring your hard work into building a model, only to find it’s overfitting due to misleading information. With the Target Leakage Report provided by Data Wrangler, you can quickly identify columns that leak information into your target variable and decide if they should be dropped or kept. This insight is vital, saving you time and preventing potential errors in predictions.
“The cost of bad data quality is inefficiency and missed opportunities.”
Creating Summaries for Better Insights
Summaries are essential for getting straightforward insights quickly. By creating summaries, you can avoid drowning in details. For instance, you might summarize customer demographics in a marketing dataset. This can highlight key segments: Who are your potential customers? What trends are emerging? With summaries, you can make informed decisions faster.
Using Analysis to Inform Further Transformations
Once you’ve laid the groundwork with your visualizations and reports, it’s time to dive into analysis. This phase isn’t just about collecting data—it's a pivotal time where insights lead to actions. With the help of the reports and visualizations from Data Wrangler, you can plan what transformations your data might still need.
For example, if your analysis shows that certain variables are skewed, you might decide to apply normalization techniques. If categorical features are overwhelming your dataset, it may be time to encode them efficiently. Each step informed by your analysis keeps the pipeline moving smoothly toward your ultimate goal: a robust machine learning model.
Importance of Data Visualization in Analysis
As you can see, the importance of data visualization in analysis cannot be overstated. A well-crafted visualization provides clarity and shines a spotlight on the characteristics of your data. You can quickly share insights with your team, making discussions around data-driven decisions more effective.
Imagine your data as a myriad of paths in a forest. Without visualization, you might wander aimlessly. But with charts and graphs guiding your way, you can navigate confidently, choosing the right path to your destination.
Examples of Reports Generated Through the Tool
Let’s say you’re using Data Wrangler for a marketing analysis. You might generate a Table Summary to visualize customer engagement. Bias Analysis would help you ensure you’re not excluding certain demographic groups. And the Target Leakage Report would assess whether you’re including misleading data in your predictions.
Your analysis, bolstered by detailed reports, ensures your model isn't just functional; it’s optimized for reliability and accuracy. Each report works in tandem to facilitate data understanding and quality.
Exporting Your Data Preprocessing Pipeline
Have you ever felt overwhelmed by the process of exporting your data preprocessing pipeline? You’re not alone! Navigating through the different methods can be a challenge, but it’s important for effective data management. Understanding how to seamlessly export your workflows will save you a lot of time and effort in the long run.
1. Different Export Methods Available
First of all, let's dive into the various export methods you can use. Data Wrangler offers four fantastic options to make exporting a breeze:
2. Integrating with Existing Codebases
Once you’ve exported your pipeline, it's time to think about integration. You want your workflows to fit smoothly into your existing codebase. Consider how the exported Python code will interact with other scripts and modules you have. A cohesive integration will streamline your workflow, allowing for smooth operations.
When you export a Jupyter notebook, you can easily adapt it to suit your development environment. Are you using libraries like Pandas or NumPy? Make sure to include the appropriate import statements in your notebook.
3. Examples of Exporting Datasets
To illustrate the exporting process, let’s consider an example. Imagine you are working with customer data from a direct marketing campaign. After processing this data in Data Wrangler, you decide to export it using the Jupyter notebook option. You run the export command, and voilà—your clean dataset is saved in S3 and is ready for your machine learning model seamlessly!
Visualizing Export Actions
Here’s a simplification of the steps:
4. Best Practices in Sharing Workflows
When it comes to sharing your workflows, there are several best practices to follow:
5. Storing Pipelines for Future Use
Finally, it's crucial to store your pipelines for future usability. Data Wrangler saves your workflows as JSON files, which are stored in .flow format. This means that not only can you quickly access previous workflows, but you can also share them with others. Remember, once you’ve created a useful pipeline, you want to reuse it later!
Additionally, consider implementing a consistent naming convention for your workflows in your Git repository. This will help you and your team locate the right pipeline quickly.
Notes on Export Options
When working within Jupyter notebooks, consider using version control systems like Git. This will keep track of your changes and help in collaboration. Moreover, being organized with your pipelines and structures can lead to a more efficient workflow.
Data Wrangler allows for seamless export of your workflows into various formats for easy integration.
Conclusion: Streamlining Your Machine Learning Pipeline
As we reach the end of our discussion on machine learning workflows, it’s essential to recap the significance of data preparation. This process is not just a prerequisite; it’s the foundation of any successful machine learning implementation. Imagine trying to build a house without a solid foundation. It won’t stand. Similarly, without well-prepared data, your machine learning models are likely to falter.
The Power of Data Wrangler
Now, let’s talk about an incredibly useful tool that can transform your workflow: Data Wrangler. Think of it as your personal assistant in the vast world of data. It simplifies the data transformation process, allowing you to focus on what truly matters—building effective models. Rather than getting lost in the intricacies of data manipulation, Data Wrangler provides you with a user-friendly interface. This tool helps you easily load, transform, and analyze your datasets without writing extensive code. The visual representations of data also make spotting trends and insights much easier.
If you’re new to data preparation, you might be feeling a bit overwhelmed. That’s perfectly okay! The key is to start small. Explore different features offered by Data Wrangler. The beauty of experimentation is that it guides you toward understanding what works best with your datasets. You might stumble upon particular transformations that significantly improve your model's performance.
Encouragement to Explore and Experiment
Don’t hesitate to dig deep into your datasets. What happens when you apply a new transformation? Will combining certain variables yield better results? Experimentation is part of the journey. Have you heard the saying, “trial and error leads to success?” That’s particularly true in machine learning. You may find out that what initially seemed like an unhelpful variable turns out to be quite significant after a few rounds of tweaking.
Next Steps in Your Machine Learning Journey
So, what comes next? Well, take the time to refine your process. Consider automating repetitive tasks that you've encountered while preparing your data. You can also delve into advanced analytics or model selection strategies. As you become more comfortable, think about branching out into different machine learning frameworks or libraries such as TensorFlow or Scikit-learn. Each new tool you explore expands your toolkit.
Moreover, joining forums or online communities can bolster your learning. Engaging with others who are also delving into machine learning can provide fresh perspectives. The landscape is ever-evolving, and staying connected opens doors to new ideas and techniques.
Share Your Journey
Lastly, I invite you to share your experiences with data preparation. How do you approach it? What tools do you find indispensable? Sharing your personal stories can offer valuable insights to others in the community. You never know who might be inspired by your journey. Remember, you’re not alone in this; we’re all learning together.
Incorporating effective data preparation practices is essential for successful machine learning implementations. Data Wrangler significantly enhances this process. By embracing the journey of data preparation and exploration, you're building the groundwork for innovative and impactful machine learning solutions.