Mastering Data Analysis in Excel: A Comprehensive Guide to Using PivotTables
Quantum Analytics NG
Become A Global Tech Talent in Demand. Attract Opportunities!
Excel’s PivotTables are among its most powerful features, enabling users to efficiently summarize, analyze, and present large datasets. Whether you’re new to PivotTables or looking to refine your skills, this comprehensive guide will walk you through everything you need to know to leverage PivotTables for insightful data analysis.
1. Understanding PivotTables
A Pivot Table is an interactive table that automatically performs data aggregation and summarization. It’s designed to simplify the process of extracting meaningful patterns and trends from complex data sets. PivotTables are highly customizable and can dynamically adjust to different analysis needs.
2. Preparing Your Data
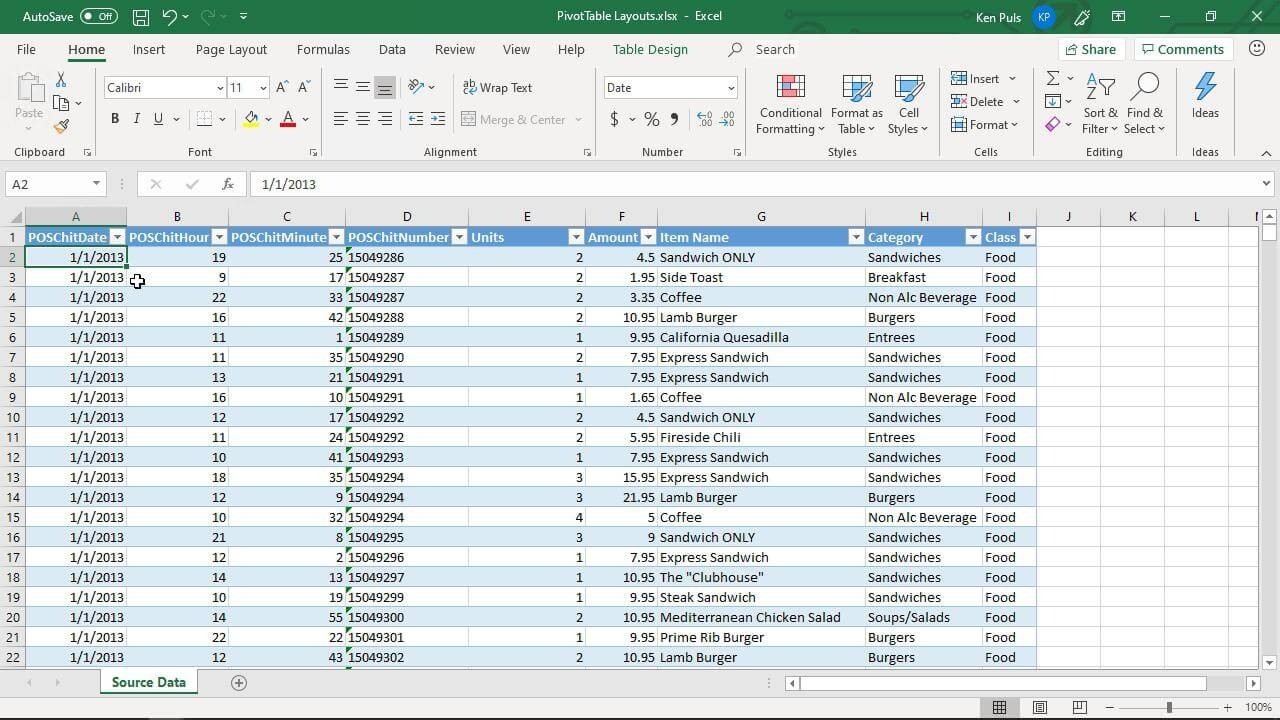
- Format as a Table: Convert your dataset into an Excel Table (Select your range and press Ctrl + T). This makes it easier to manage and analyze data.
- Avoid Blank Rows/Columns: Ensure there are no blank rows or columns in your dataset as this can affect the PivotTable's functionality.
- Clear Headers: Make sure each column has a unique header to serve as field names in your PivotTable.
Define Your Data Range
- Before creating a Pivot Table, ensure your data range is well-defined. If your dataset is in a table format, Excel will automatically recognize the entire range.
3. Creating Your First PivotTable
Step-by-Step Process
Adding Fields to Your PivotTable
4. Customizing Your PivotTable
Sorting and Filtering
Grouping Data
Using Slicers
5. Performing Advanced Analysis
Calculated Fields
Using Multiple Consolidation Ranges
领英推荐
Refreshing Data
6. Best Practices for PivotTable Analysis
Use Clear Naming Conventions
- Ensure field names are descriptive and meaningful to make your PivotTables easy to understand and interpret.
Optimize for Performance
- For large datasets, consider using Excel’s Power Pivot add-in for enhanced performance and advanced data modeling.
Document Your Work
- Keep track of your PivotTable design, calculations, and filters. Documenting your work helps in understanding and revisiting your analysis later.
7. Troubleshooting Common Issues
Data Not Updating
- Ensure the data range is correct and use “Refresh” to update the Pivot Table.
Inaccurate Calculations
- Check the “Value Field Settings” to ensure the correct aggregation function (sum, average, etc.) is applied.
Field Not Showing
- Verify that the field is not accidentally hidden or placed in an incorrect area (Rows, Columns, Values).
PivotTables are a powerful tool for data analysis in Excel, offering flexibility and depth in summarizing and interpreting your data. By mastering the basics and exploring advanced features, you can turn complex data into actionable insights and enhance your decision-making process.
We do hope that you found this blog exciting and insightful, For more access to such quality content, kindly subscribe to Quantum Analytics Newsletter here.
Stay connected with us for more insights on data analytics, and share your experiences with validation techniques in the comments below!
What did we miss here? Let's hear from you in the comment section.
Follow us Quantum Analytics NG on LinkedIn | Twitter | Instagram | Facebook
Management Information Technology
7 个月Thanks for sharing