Market Mojo: Learning the Lingo
William Corley
Author of Financial Fitness: The Journey from Wall Street to Badwater 135; Professional Money Manager with 1DB.com.
Every savvy investor knows that knowledge is an invaluable asset. On Wall Street, a tempest of jargon, acronyms, anecdotes, storylines, traditions, and intricate concepts swirls around, enough to daunt even the most astute minds. It is in the eye of this storm that the circumspect investor may find their edge. Gaining fluency in the language of finance isn't just a step, but a leap towards making informed decisions. It's about turning noise into notes, risks into rewards, and challenges into opportunities.
"On Wall Street, experience is the cornerstone of success."
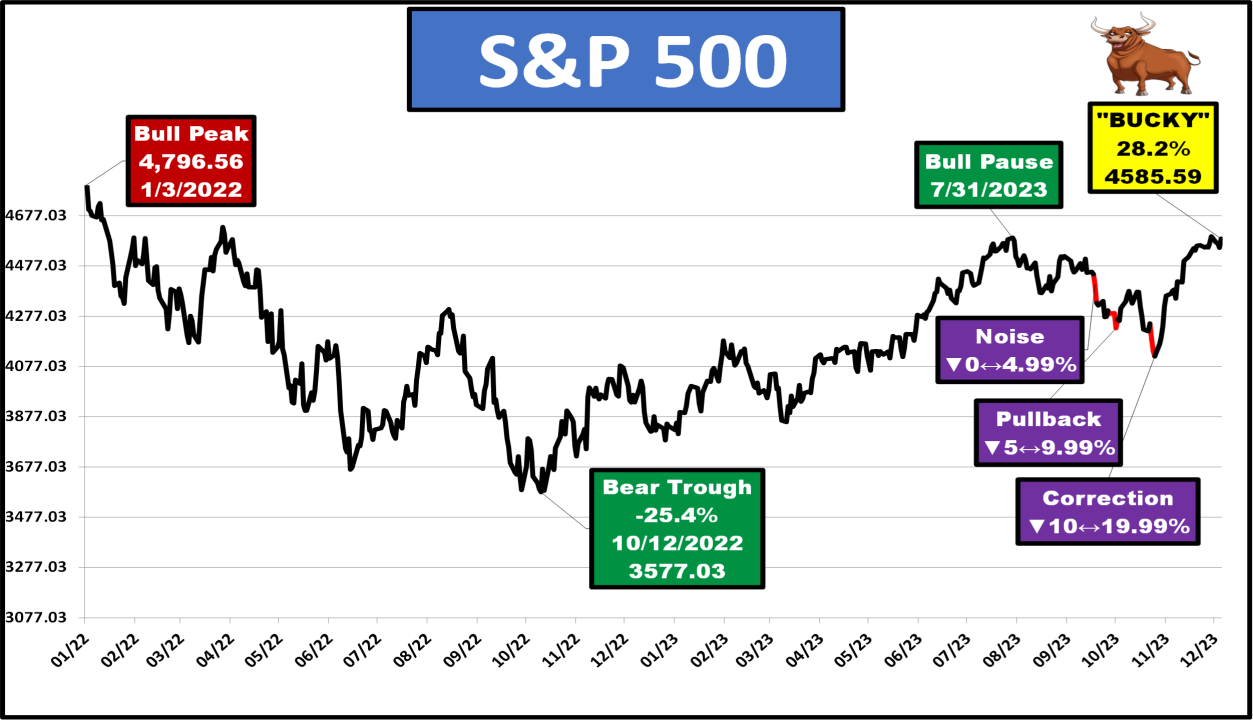
1. Bull Peak (1/3/2022): The chart begins by showing a previous high point for the S&P 500, indicating the market was completing a bullish phase. The index reached a level of 4,796.56, signaling strong investor confidence and a robust period of rising stock prices. A bull market is confirmed once the index has risen 20% from the previous low point.
2. Bear Trough (10/12/2022): Following the peak, the market experienced a significant downturn, with the S&P 500 plummeting 25.4% from its previous high, a decline of 20% is the threshold for entering a bear market. This point is marked as the "Bear Trough" at 3,577.03, reflecting a period of prolonged negative sentiment and declining stock prices.
3. Noise: Throughout the timeline, there are several instances of minor fluctuations in the index, which are indicated as "Noise." These fluctuations are less than 5% and are typical in both bull and bear markets, often caused by day-to-day market volatility and not indicative of a broader market trend.
4. Pullback: The chart also illustrates "Pullbacks," which are moderate declines in the index of 5% up to 9.99%. Pullbacks are considered normal retracements in a bull market and can occur within bear market rallies as temporary upward movements against the broader downward trend.
领英推荐
5. Correction: The term "Correction" is used to describe a more pronounced decline in the index of 10% to up to 19.9%. This is a deeper and more sustained pullback, which can occur within both bull and bear markets, often seen as an opportunity to adjust investment strategies.
6. Bull Pause (7/31/2023): Later in the chart, a "Bull Pause" is noted, indicating a period where the upward momentum of a recovering or existing bull market takes a breather. It's a consolidation phase where the market doesn't significantly move up or down but suggests a potential for resumption of the upward trend.
7. Bucky (Current): Lastly, the chart depicts a strong recovery. I have named the current bull market "Bucky Da Bull". Since its inception on October 12, 2022, Bucky has risen by 28.2%. The market has fully transitioned into our bull market phase, having increased more than 20% from the trough of the previous bear market.
"High-powered shout-out to the 'Maven of Manhattan,' Sam Stovall, CFRA Chief Investment Strategist, for informing market participants that there have been 61 pullbacks, 24 corrections, and 13 bull and bear markets since WWII."