K-Nearest Neighbors Explained: A Guide to Classification Algorithms
K-Nearest Neighbors (KNN) is a simple yet powerful algorithm used for classification and regression tasks in machine learning. This article will explore the KNN algorithm, its implementation using the Iris dataset, and the underlying mathematics that make it effective.
What is KNN?
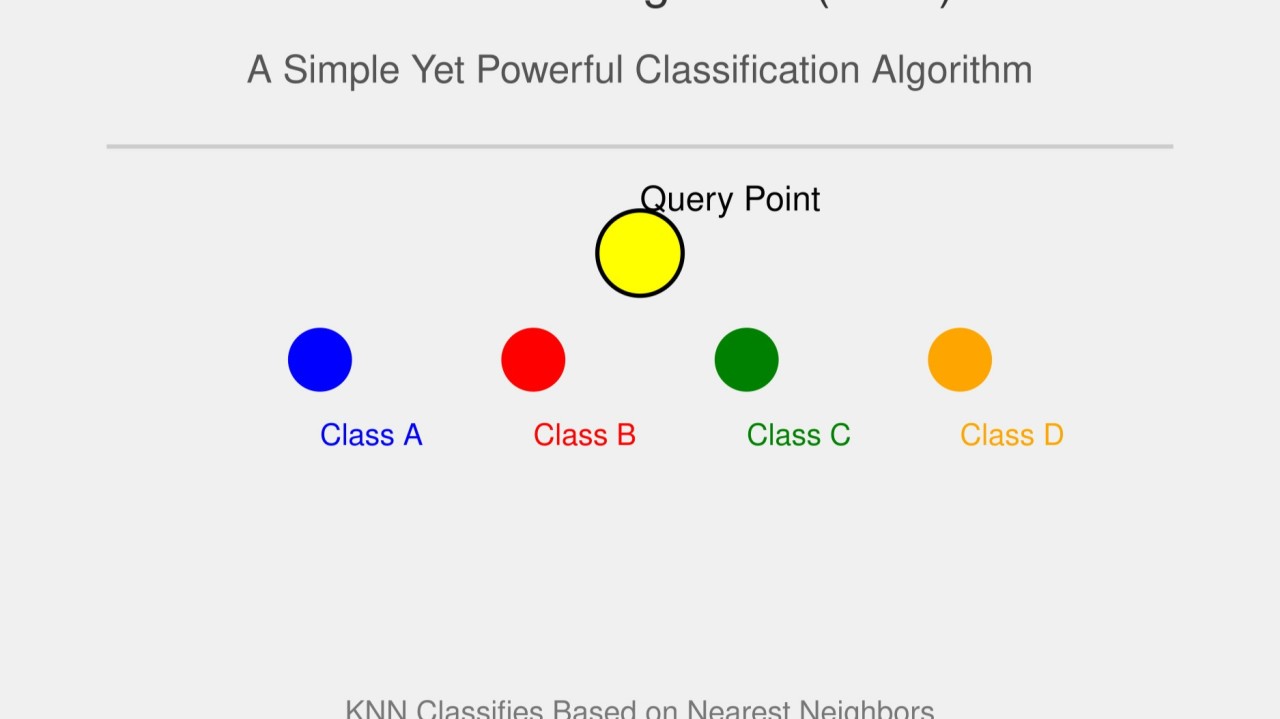
KNN is a non-parametric, instance-based learning algorithm that classifies data points based on their proximity to other data points. The core idea is straightforward: given a new data point, KNN looks at the ‘K’ nearest labeled data points and assigns the most common label among them.
Key Concepts
2. Choosing K: The value of K determines how many neighbors influence the classification. A small K can be sensitive to noise, while a large K can smooth out the decision boundary.
Implementing KNN with the Iris Dataset
The Iris dataset is a classic dataset used in machine learning, containing measurements of iris flowers from three different species. Let’s walk through the implementation of KNN using Python.
Step 1: Import Libraries
import matplotlib.pyplot as plt
from collections import Counter
import numpy as np
Step 2: Load the Dataset
We load the Iris dataset, which is assumed to be in CSV format.
领英推荐
main_df = np.loadtxt("datasets/iris.csv", delimiter=",", dtype=str)
Step 3: Define the KNN Function
The knn function calculates the distances between a query point and all other points, then returns the K nearest neighbors.
def knn(df, X, Y, x, y, k):
    distances = np.sqrt(((X.astype(float) - x.astype(float)) ** 2) + ((Y.astype(float) - y.astype(float)) ** 2))
    dis_indexes = distances.argsort()[1:]  # Exclude the point itself
    return df[dis_indexes[:k]]
Step 4: Define the Prediction Function
The predict function determines the most common class among the K nearest neighbors and handles ties by averaging distances.
def predict(nbrs_list, x1, y1):
    varieties = nbrs_list[:, -1]
    unique, counts = np.unique(varieties, return_counts=True)
    count_vars = dict(zip(unique, counts))
    if len(unique) == 1:
        return unique[0]
    else:
        count_dict = Counter(count_vars.values())
        result = [key for key, value in count_vars.items()
                  if count_dict[value] > 1]
        if result:
            dict1 = {}
            for value in unique:
                vals = nbrs_list[nbrs_list[:, -1] == value]
                counter = 1
                distances = 0
                for val in vals:
                    distance = np.sqrt(((val[0].astype(float) - x1.astype(float)) ** 2) +
                                       ((val[1].astype(float) - y1.astype(float)) ** 2))
                    distances += distance
                    counter += 1
                average_distance = distances / counter
                dict1[value] = average_distance
            return min(dict1, key=dict1.get)
        else:
            inverse = [(value, key) for key, value in count_vars.items()]
            return max(inverse)[1]
Step 5: Evaluate Different Values of K
We evaluate the performance of KNN for different values of K (from 2 to 10) and plot the results.
ks = {"k2": 0, "k3": 0, "k4": 0, "k5": 0, "k6": 0, "k7": 0, "k8": 0, "k9": 0, "k10": 0}
for k in ks:
    pk = []
    for i in range(1, main_df.shape[0]):
        neighbours = knn(main_df[1:], main_df[1:, 0], main_df[1:, 1], main_df[i, 0], main_df[i, 1], int(k[1:]))
        predicted_variety = predict(neighbours, main_df[i, 0], main_df[i, 1])
        pk.append(predicted_variety)
    ks[k] = sum(main_df[1:, -1] == pk)

plt.plot(["k2", "k3", "k4", "k5", "k6", "k7", "k8", "k9", "k10"], [ks[k] for k in ks])
plt.xlabel('Value of K')
plt.ylabel('Number of Correct Predictions')
plt.title('KNN Classification Accuracy for Different K Values')
plt.show()
Conclusion
K-Nearest Neighbors is a powerful and intuitive algorithm for classification tasks. By understanding its mechanics and implementing it with the Iris dataset, you can appreciate its effectiveness in real-world applications. Whether you’re a beginner in machine learning or looking to refine your skills, KNN is a great starting point.
Feel free to explore the code, modify the parameters, and see how KNN performs on different datasets! If you’d like to view the complete code, you can clone my repository from GitHub: Clone the KNN Model Demonstration Repository