Exploratory Data Analysis (EDA) in Machine Learning: Unlocking Insights from Your Data
Aditya Mishra
CSE sophomore |MERN stack |2? at CodeChef | 1550+ CR at LeetCode | aspiring SDE | 'Solved 800+ DSA problems | 5? @HackerRank Coder | Fluent in Professional English | 90% Achiever in 12th Grade
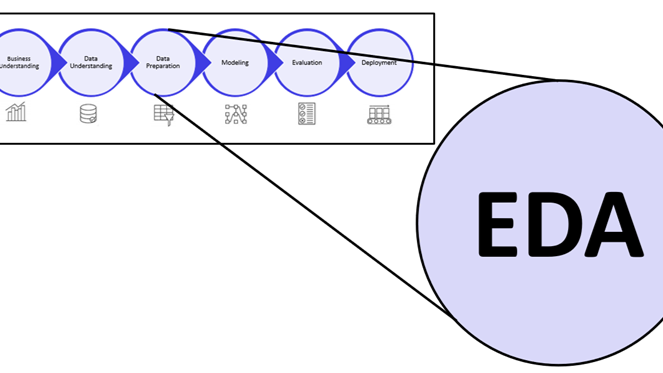
In the realm of machine learning, Exploratory Data Analysis (EDA) is a crucial step that helps you understand the underlying patterns, relationships, and structure of your data. It’s the foundation upon which you build your models, ensuring that you’re working with clean, relevant, and well-understood data.
What Is EDA?
EDA is the process of analyzing datasets to summarize their main characteristics, often using visual methods. It’s not just about running algorithms or using tools—it’s about taking the time to explore the data, understand its nuances, and uncover insights that might not be immediately obvious.
This step is essential for identifying potential issues such as missing data, outliers, and correlations that could affect the performance of your machine learning models.
Why Is EDA Important in Machine Learning?
- Data Quality: EDA helps in assessing the quality of your data. By identifying missing values, anomalies, and errors, you can clean your dataset before feeding it into a model.
- Understanding Relationships: Through EDA, you can discover relationships between variables, which is crucial for feature selection and engineering. Understanding how variables interact can guide you in choosing the right model and improving its accuracy.
- Hypothesis Generation: EDA allows you to generate hypotheses about your data that can be tested with more formal statistical methods. It’s a way to get a "feel" for the data before diving into complex models.
- Preventing Overfitting: By understanding your data better, you can avoid overfitting your model to irrelevant patterns or noise, leading to more robust predictions.
Key Techniques in EDA
Descriptive Statistics
Start with summary statistics like mean, median, mode, and standard deviation. These give you a quick overview of the central tendency, dispersion, and shape of your data distribution.
领英推荐
Data Visualization
Visual tools like histograms, box plots, scatter plots, and correlation matrices are invaluable in EDA. They help you spot trends, outliers, and relationships that might not be obvious from the raw data.
Handling Missing Data
Identify missing values and decide how to handle them—whether by imputing, removing, or flagging them as a separate category.
Correlation Analysis
Use correlation matrices and scatter plots to explore relationships between features. Understanding these correlations can help in reducing multicollinearity and selecting the most relevant features.
Distribution Analysis
Analyze the distribution of each feature to understand its characteristics. Skewed distributions might need transformation to improve model performance.
Example of EDA in Action
Imagine you’re working with a dataset to predict house prices. Before jumping into model building, you perform EDA to understand your data:
Descriptive Statistics
You calculate the average, median, and range of house prices.
CSE(AI&ML) 4th year @KMCLU Lucknow | Artificial intelligence &Data science enthusiast
7 个月Very informative