Dynamic Column Part 1 - PQ
Shivanshu Bisht
Sr. Business Analyst (Microsoft Fabric, Power Bi Developer, Power Apps, Power Automate, Paginated Reports)
Intro -
Hi everyone,
It’s been a while since I last published a blog, and so much has happened! Recently, I had the incredible opportunity to attend the 2024 European Microsoft Fabric Community Conference in Sweden. What an amazing experience it was!
Not only did I get to explore the latest advancements in Power BI and Fabric, but I also had the privilege of meeting some of the biggest names in the field. Connecting with such knowledgeable professionals has truly been inspiring.
Here are a few moments captured from the conference:
Topic Starts
Core of the problem
After much discussion, it’s time to dive into today’s topic: Dynamic Columns.
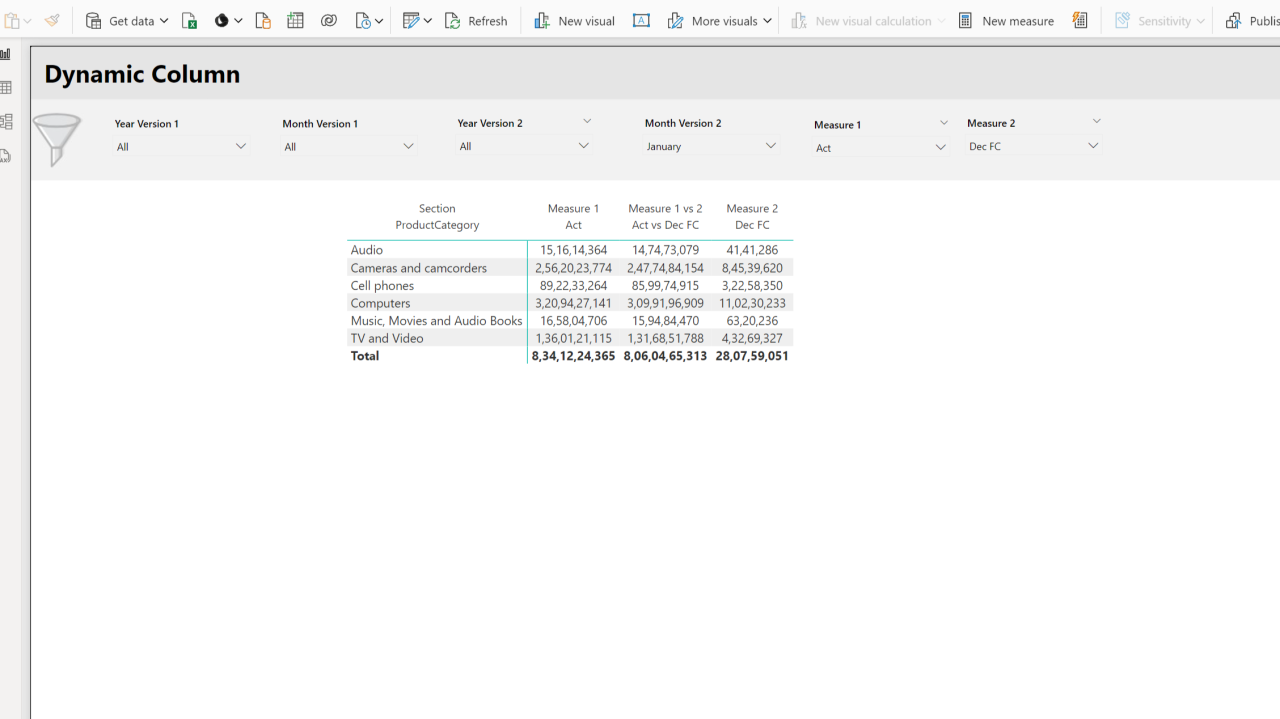
Whenever a client asked for dynamic headers, we could sometimes achieve this with Field Parameters, depending on the complexity of the request. However, it can quickly become a challenge if the client needs functionality with multiple measure pickers. For example, let’s say they need three measure pickers along with a dynamic variance comparison across three columns—this can be a developer’s nightmare.
In this blog, I’ll demonstrate how to enable this functionality with two measure pickers. However, I’ve successfully implemented it with three measure pickers and three variance comparison columns, so you’re welcome to adapt this method, modify it as needed, and share your results!
Solution Overview -
To keep things simple, I’ve divided this guide into two parts:
Most of us work with a fact table that contains columns for Actuals, Budget, and Forecast numbers. In some cases, we might have a single column for sales numbers, with another column specifying values like Actuals, Budget, and Forecast to identify which number type each row contains.
No matter the structure of your table, a similar solution can work in either case.
Step 1: Create a Measure Picker Dimension
To start, create a custom table using the Enter Data feature, as shown below:
Column Descriptions:
Step 2: Merging Measure Picker Tables
At this point, all tables have the same structure and identical values.
Step 3: Modifying the Tables
After these modifications, the Version Merge 1 table will have a structure similar to the following:
After these changes, the Version Merge Variance table will have the following structure:
Step 4: Append & Load
Make sure to uncheck the "Enable Load" option for all other tables to keep the data model clean and efficient.
Conclusion
At this point, we have all the necessary tables in place. The final step, which involves modeling and DAX, will be covered in the next blog post.
Feel free to adapt this solution for more measure pickers if needed. The approach I’ve outlined here works seamlessly, and you can easily scale it to three or more measure pickers as required.
You might be wondering why I didn’t use Field Parameters for this solution. In my next blog, I’ll be diving into the advantages and disadvantages of both approaches to help you decide which one works best for your specific use case.
Data Analyst at WTW || POWER BI || SQL || ZOHO ANALYTICS || AWS QUICK SIGHT|| AWS RED SHIFT || PYTHON || POWER AUTOMATE || POWER BI BUILDER|| SAP FICO|| EXCEL
3 个月Insightful
Deputy Manager - Data Analytics & Reporting in HCLTech | MBA in IT, Microsoft Certified Data Analyst (PL-300)
3 个月Very informative!!
Power BI Developer | Specializing in Data Science & Analytics | Transforming raw data into strategic insights
3 个月This looks intriguing. Love it