Dashmap: Spatialized Intelligence
Humans have been recording and analysing data for centuries. Writing, for instance, was developed in ancient Mesopotamia around 3100BC because bureaucrats needed an efficient tool to record and track citizen information. Since The Babylonian Empire governments have held censuses to gather huge datasets on their citizenry, livestock and resources for taxation purposes. Putting available resources on record enabled more efficient management and made the growth of states larger than the old city-states possible. In turn, larger states started to envelop larger and more diverse resources leading to even larger census data. This positive feedback loop went largely uninterrupted for centuries planting the seed for what today we recognise as statistics.?
"The word statistics ultimately derives from the modern Latin term statisticum collegium (“council of state”) and the Italian word statista (“ statesman” or “ politician”). The German Statistik, first introduced by Gottfried Achenwall (1749), originally designated the analysis of data about the state, signifying the “science of state” (then called political arithmetic in English)"
While the science of statistics has changed since the 18th century the abstract constructions we use to store records have remained relatively unchanged. One of the well-known forms of data representation is the tabular structure invented by the Babylonians and still used presently. In tabular representations data is usually organised into a grid structure that shows the relationships between rows and columns of entries. This structure is incredibly efficient in relating numerical entries to each other but for the ancient “science of the state”, this enumeration was merely means to an end. There was still a need to relate the numerical relationships to the experiential field i.e. three-dimensional space. But the predominant methods of representing spatial relations were vastly different from the methods for representing numerical relations. Spatial relationships were defined with local maps (including architectural drawings) that utilised the knowledge of geometry at the time. As a result of this difference in the forms of representation relating census data to spatial maps was done by encoding and naming conventions that related the label of the territory with the data associated with it. The boundaries of the spaces were defined separately on maps and drawings using geometry. This practice of isolating spatial and non-spatial information survived the test of time, largely thanks to its simplicity, and today it can be found at the foundation of a great number of modern technologies.
Despite the fact that both tables and maps have evolved today, the underlying principles behind them altered only marginally. What has changed dramatically is the way humans interact with information. Already in the 18th century, it was evident that while tabular structures were efficient for storing the information they were not ideal for viewing it. Mathematician and architect William Playfair, when he was not busy with collapsing the French national currency, came to the same realisation and developed methods of summarising and displaying data. Often credited as the father of infographics his diagrams(bar chart, piechart) can be found nearly in every corner of the internet where the speed of delivery has become a crucial requirement.
His diagrams allowed viewers to gain insights into the underlying data at a glance. They summarised the main trends and delivered information faster in a way accessible to many.?
Dashmap.io
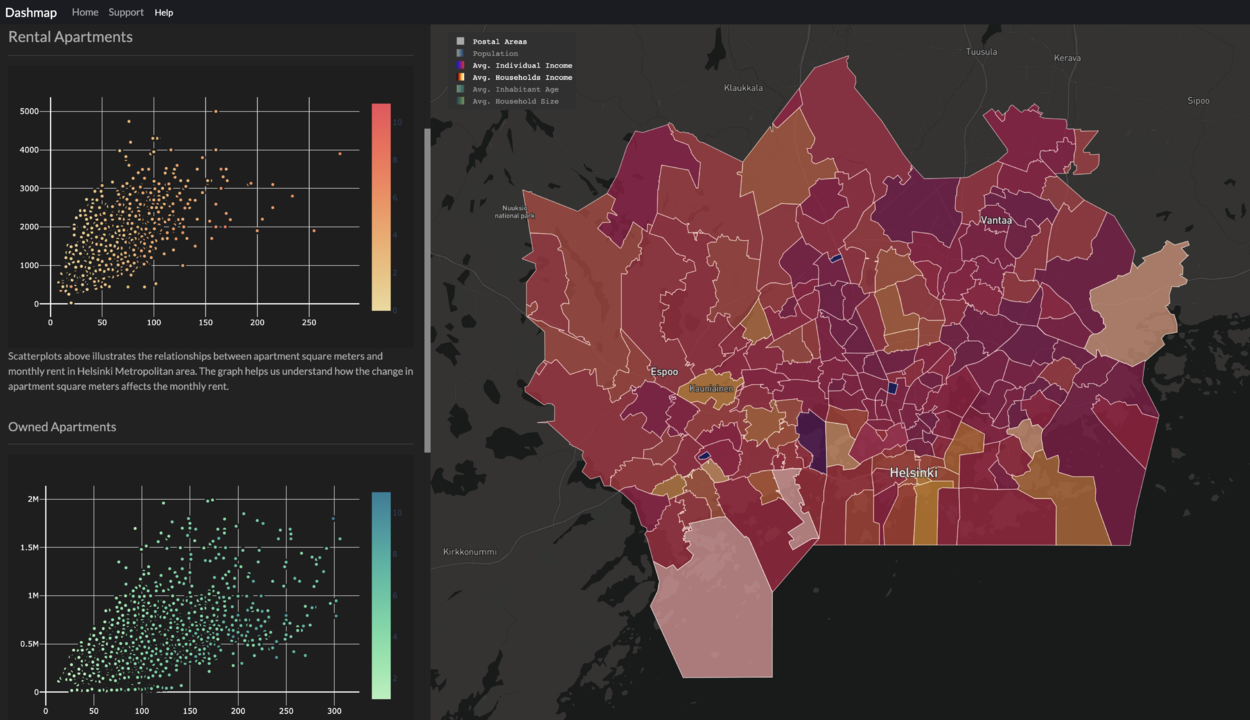
With these questions and considerations in mind, I developed an open-source web platform that gathers, analyses and visualises urban data In Helsinki metropolitan area. It utilises the interactivity of web technologies to relate spatial and tabular data at the same time presenting insights in the form of accessible dashboards.
The platform attempts to address a fundamental problem present in modern open data ecosystems.
Problem: Modern cities have a rich open data ecosystems however the lack of technical skills often prevents people from using the available data.
An average citizen creates 160 gigabytes of data per day. Modern cities and corporations have gotten very efficient in capturing and analysing this data. For a variety of technical reasons the data produced by citizens is often available in complex file format and is accessed through convoluted API requests. This is great for machines but looking at this data will often make your eyes bleed. DashMap.io empowers non-tech users by providing access to open data through interactive and accessible dashboards.
The website organises data into 5 main categories.
领英推荐
Census:
A census is a complete enumeration of population and its vital characteristics. Censuses are created by systematic recording and aggregation of data about the members of a given population. The purpose populations census is to understand the basic structure of the society and identify emerging patterns and trends.
Real Estate:
Real estate is a type of real property consisting of land along with any permanent improvements attached to the land. The included resources can be mane made or natural. They can include water, trees, crops minerals and built structures. Often the value of real estate is one of the key indicators of an economy’s health.
Services
A service is a transaction in which no physical goods are transferred from the seller to the buyer. Services may be defined as acts or performances whereby the service provider provides value to the customer using resources, skill, ingenuity or experience.
Mobility
Geographic mobility is the measure of how populations and goods move over time. Population mobility has a large impact on many sociological factors in a society and has implications ranging from impacts on local economic growth to housing markets and demand for regional services.
Environment
The environment refers to the environmental conditions created as byproduct of manmade and natural processes. It includes metrics like pollution, noise, wind patterns and radiation levels.
Each tab contain multiple sections providing insights based on a higher granularity data.
Open source
As mentioned before the purpose of DashMap is to empower individuals and business to utilise open data in their decision making process. Therefore it is crucial that the platform is open source. The whole codebase behind Dashmap can be found in here:
Contributions and pull requests are welcome!
Conclusion
Open data ecosystems will continue to grow in the future. However, open data should benefit everyone not just companies who monetise data platforms. Therefore more platforms are needed that can empower individuals and business to utilise open data without paying the huge upfront costs associated with app developing. Dashmap provides this platform for Helsinki metropolitan area. If you would like to make one for your city feel free to use Dashmap as a launching platform.