CT Magnetisation Curve Testing
Prescon Engineering
Electrical Assets Management & Condition Assessment | Installation, Testing & Commissioning |
CT application is highly dependent upon the susceptibility to magnetic core saturation, i.e. magnetising impedance saturation, see Figure 1 below. Saturation is mostly caused by DC transient components of fault current.
A CT magnetisation curve (generally termed a ‘mag curve’) test is used to determine the secondary voltage at which the CT commences to saturate. This voltage is compared with the manufacturers test data to confirm that the correct CT has been installed.
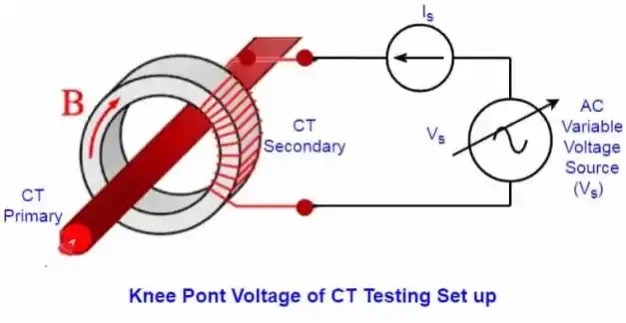
Figure 2(a) below shows the test arrangement for a CT magnetisation curve. Prior to the test commencing, the test voltage is increased to drive the CT into saturation, as indicated by rapid increase of current (beyond the knee point), and then slowly reduced to zero – this process removes any remnant magnetism from the core which may corrupt the test results.
The test commences by increasing the test voltage (from zero) in increments, to provide a graphical plot of voltage against the corresponding current. This continues until the ‘knee point’ of the CT is reached. This is defined as that point on the curve of the graph where a 10% increase in voltage causes a 50% increase in current, as shown in Figure 2(b). The knee point indicates significant onset of saturation.
In practice, knee points range from typically 200 V, for distribution network CTs, to 3 kV for transmission networks. For CTs, with very high knee points, the test equipment may not be capable of delivering such a high voltage, and therefore only a partial plot for comparison with the manufactures test data will be taken – which will usually suffice. Furthermore, the injection of such high voltages risks damaging the secondary wiring.