Automating Business Insights with AI-Powered Multi-Agent Systems
Introduction
The rise of Large Language Models (LLMs) has revolutionized how businesses translate natural language inputs into SQL queries or executable code for analytics, insights, and reporting. Tools like NLP2SQL or NLP2Python dynamically generate queries by analyzing data schemas on the fly, making them invaluable for handling diverse requirements without the need for bespoke development.
However, while these capabilities efficiently handle individual queries, imagine a system that could automatically generate a comprehensive set of insights and reports, compile them into a single document, and make them accessible to users regularly. This concept drives us to explore the use of an LLM-powered multi-agent framework for automating this process.
The Solution
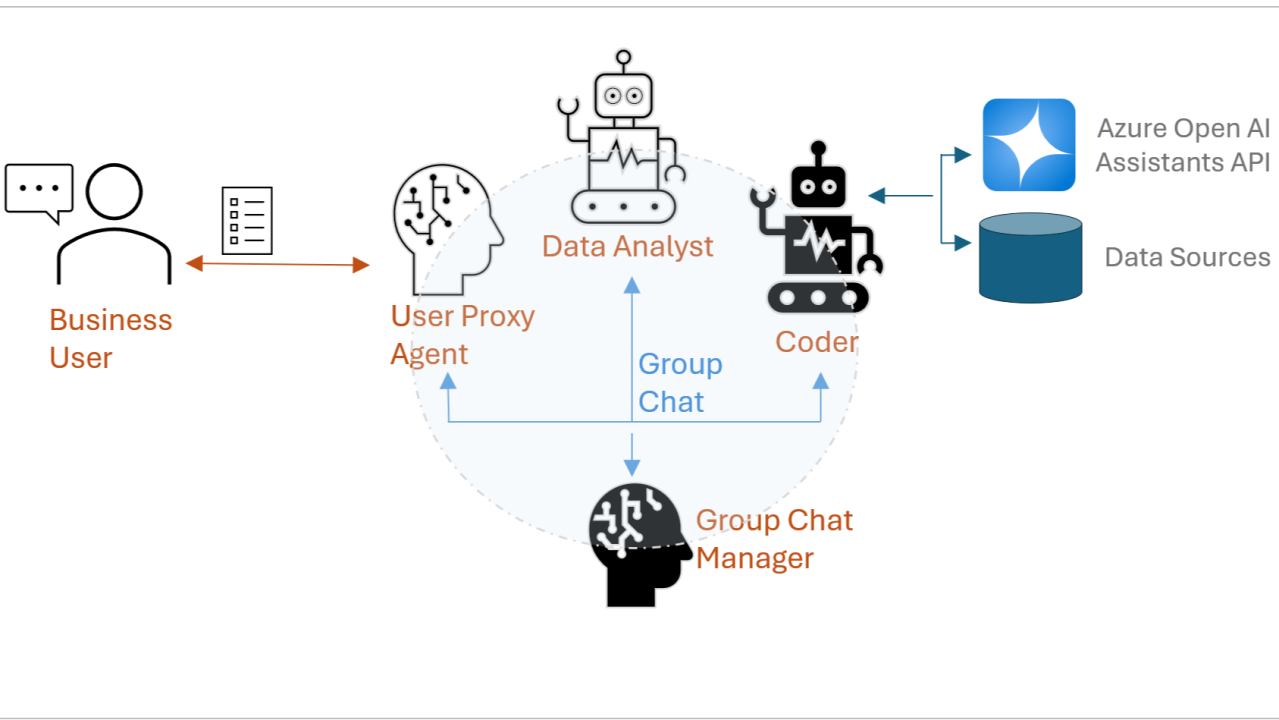
In pursuit of this vision, I explored the autogen framework, developed by Microsoft, which simplifies the creation and management of complex workflows involving LLMs like GPT-4 Omni. autogen enables the orchestration of multi-agent conversations, seamlessly integrating LLMs, human inputs, and various tools to solve tasks more efficiently.
Key Expectations of the Solution:
User Input and Reporting:
A typical user input might involve specifying the month for which the report is needed and selecting a template. The system can then generate the required report format from a variety of predefined templates.
领英推荐
Sample Report Template:
Here’s a preview of a proof-of-concept report template designed for a monthly business insights report:
Monthly Business Insights Report Template
________________________________________

# Vanarsdel Monthly Business Insights Report for $month_for_reporting

Prepared by: <Provide your persona name as an AI Assistant>

Report Date: [$CurrentSystemDate]

________________________________________

## Executive Summary

Overview of Key Insights:

$ExecutiveSummary for the month $month_for_reporting

________________________________________

## Total Product Sales Performance by Category for the month $month_for_reporting

Insights Overview:

    $SectionSummary

Data Summary:

    o   Top 5 Categories by Revenue for $month_for_reporting:

        | Category       | Revenue    |

        |----------------|------------|

        | Category 1     | $[Revenue] |

        | Category 2     | $[Revenue] |

        | Category 3     | $[Revenue] |

        | Category 4     | $[Revenue] |

        | Category 5     | $[Revenue] |

Visualization:

    Bar Chart: Insert bar chart showing Total Sales revenue by Category performance for the month $month_for_reporting

Instructions for Generation: (not to be included in the generated report content)

1.  Aggregate sales data by Categories for the month in question.

2.  Rank regions based on total revenue.

3.  Visualize using a bar chart, and save that in the working folder as an image.

    1. Display this image in the final report as an image in the Microsoft Office Word document

    2. Save the final .docx document in the working folder

________________________________________

## Total Product Sales Revenue by Category comparison between the month $month_for_reporting and $month_for_reporting -1

Insight Overview:

    $SectionSummary

Data Summary:

    o   Top Product Sales Revenue by Category comparison for $month_for_reporting and  $month_for_reporting-1:

    | Category   | Total Revenue for $month_for_reporting  | Total Revenue for month  $month_for_reporting-1  |

    |----------|----------|------------|

    | Category 1 | $[Revenue] | $[Revenue] |

    | Category 2 | $[Revenue] | $[Revenue] |

    | Category 3 | $[Revenue] | $[Revenue] |

    | Category 4 | $[Revenue] | $[Revenue] |

    | Category 5 | $[Revenue] | $[Revenue] |


### Instructions for Generation:

1.  Aggregate sales data by Zip and ProductID.

2.  Sum the Revenue for each Zip and product combination.

3.  Rank regions based on total revenue.

4.  save the final .docx document in the working folder

________________________________________

## Product Performance by Region for the month $month_for_reporting

Insight Overview:

    $SectionSummary

Data Summary:

    o   Top 5 Regions by Revenue for $month_for_reporting:

    | Region   | Zip Code | Revenue    |

    |----------|----------|------------|

    | Region 1 | [Zip Code] | $[Revenue] |

    | Region 2 | [Zip Code] | $[Revenue] |

    | Region 3 | [Zip Code] | $[Revenue] |

    | Region 4 | [Zip Code] | $[Revenue] |

    | Region 5 | [Zip Code] | $[Revenue] |

Visualization:

    o   Pie chart chart: Insert Pie chart chart showing regional performance.

### Instructions for Generation:

1.  Aggregate sales data by Zip and ProductID.

2.  Sum the Revenue for each Zip and product combination.

3.  Rank regions based on total revenue.

3.  Visualize using a Pie chart, representing the Zip Code vs Total Revenue, and save that in the working folder as an image.

    1. Display this image in the final report as an image in the Microsoft Office Word document

    2. Save the final .docx document in the working folder
Building the Solution:
This solution leverages the autogen framework, integrated with the Azure Open AI Assistants API Framework v2. The Coding Assistant analyses the backend data sources, generates and runs Python code, and surfaces analysis and insights. It uses the autogen provided GPTAssistant and OpenAI Assistant, as described here -?Agent Backed by OpenAI Assistant API | AutoGen (microsoft.github.io)
Running the Sample:
A short video (linked below) demonstrates this solution in action, showcasing how the document is automatically created upon completion.
?