8) Being in a state of flow(charting)
Gabor Szabo
Sr. Principal Engineer, Quality, Reliability, Operations Excellence, Manufacturing at Edwards Lifesciences, R Developer
Today we look at how to draw simple flowcharts in R.
I think I am not far off when I say that flowcharts are an essential tool in the engineering toolbox. They provide a visual way to describe a set of activities, or a a process if you will. This can range from listing sequential steps in a manufacturing process to laying out a project plan to describing a decision making process (think decision trees).
“If you can't describe what you are doing as a process, you don't know what you're doing.” - W. Edwards Deming
It comes as no surprise that engineers love to use flowcharts to describe or document stuff. If you’re like me, you’ve probably used various Microsoft Office applications to draw flowcharts. I, for example, have mastered creating flowcharts in PowerPoint over the years. Some prefer Visio or maybe some other application (Figma, Miro and the like).
It should also not come as a surprise that it is possible to make great-looking flowcharts in R as there are various packages out there that facilitate it, diagrammeR being one of them. What I have found is that a lot of times, especially in the case of more complex flowcharts, it is easier to just make one using your favorite desktop application, and that’s what I’ve done myself over the years. It’s still worth taking a look at diagrammeR as it is highly customizable and has a ton of fuinctionality.
As for simple flowcharts: I recently stumbled upon a fairly new package called ggflowchart developed by Nicola Rennie . ggflowchart is a great package that allows you create simple flowcharts with ease. Let’s go through a couple examples!
To get started, let’s install ggflowchart and call the libraries that we will be using. Click here for the full script.
Using the package is really easy: the ggflowchart() function take a dataframe with two columns. One is for “from” node names, the other is for “to” node names (in other words, this is how you specify the directionality of the flow). Let’s look at a simple example.
We’ve simply created a flowchart consisting of three steps, Step 1, Step 2 and Step 3, and specified the flow. This is what the end result looks like. Pretty sweet.
OK, let’s look at a somewhat more complex example, which will be a specific kind of decision tree called a search tree* (or diagnostic tree) used in the diagnosis of product quality or reliability-related problems. The specific search tree we are going to build is for the process characterization example discussed in previous editions, 3) A Pivotal Moment, 4) Small Multiples, Huge Advantage and 5) Small Multiples for Characterization.
Let’s see what the code looks like. Note that for this decision tree, we did some customization such as text size, text color, arrow color and such.
OK, time to see what the object looks like:
Not too shabby for a quick and dirty function call, right?
领英推荐
A custom function to draw a simple flowchart
To save some time, one could create a custom function to speed up creating simple flowcharts where there is only one stream (no decision points, parallel flows or diversions). An example of this could be a simple manufacturing process.
I went ahead and wrote a cimple simple function called draw_flowchart() that accomplishes what I describe above. The function simply takes a vector of the steps (in order of appearence) as well as another vector for additional information about each of the steps. You can also add a title as well as specify the width and height of the boxes for the steps.
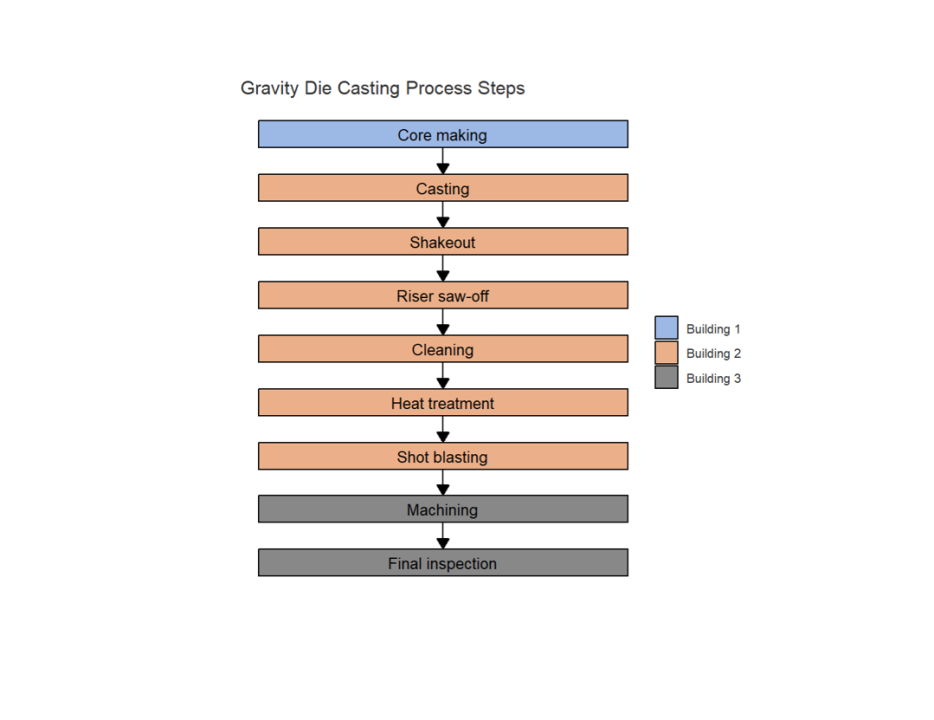
We can now use this simple function to create a flowchart for a gravity die casting process. Let’s see what this looks like. The vector called casting_process_steps lists the process steps in order of appearance in the final flow chart, and the vector called location contains additional information about the location of each of the steps (in terms of which building of the plant each step takes place).
When we run the function not specifying location in the category argument, this is what we get:
Here’s what we get when we specify location in the category argument:
This looks even better as it displays additional information about each of the steps (which building they take place). It is easy to see how coloring the steps based on a categorical variable can provide more information about the process.
I hope you enjoyed this week’s edition!
Resources for this week’s edition:
Resources for learning R:
* Source: Diagnosing Performance and Reliability, David J. Hartshorne and The New Science of Fixing Things, 2019?
Amazon Sub Same Day | Program Management | Operations Integration
1 年This is fantastic Gabor. I had no idea that the ggflowchart package even existed. Thanks for sharing!
Data visualisation specialist
1 年Thanks for sharing some examples of {ggflowchart} and for highlighting how useful flowcharts can be for understanding processes! Great examples!
Sharing my journey to becoming a Generative AI Data Scientist. Join 1,000+ in my next free workshop. ??
1 年Nice work Gabor!
Advancing Organizational Excellence at CBI | Implementing Quality Guidelines, Enhancing Service Quality, and Streamlining Processes
1 年New information about creating a Flowchart using R Thank you for sharing
C.I. & OpEx Leader | MSc | MBB | CQE
1 年I’m working on use cases for ChatGPT as a process improvement tool and one of the interesting things I stumbled upon was its ability to process a detailed workflow and identify areas of opportunity or constraints. I wonder if this functionality could be integrated into an R package using open ai as an engine? Thanks for the info! I didn’t know R could be used for flowcharting :)