5 Essential Dashboards for Customer Satisfaction, Defect Tracking, and Agile Success
Hey there, Data Enthusiasts!
Quick question – does project management feel like it gets more complex every day? ?? If you’re leading a team, you know that balancing customer satisfaction, defect management, and Agile performance can feel like juggling too many things at once. But what if you had a way to simplify it all with real-time insights?
In today’s edition,
Let’s break down the 5 essential dashboards that can reshape your team’s approach to project management, driving efficiency, quality, and unforgettable customer experience.
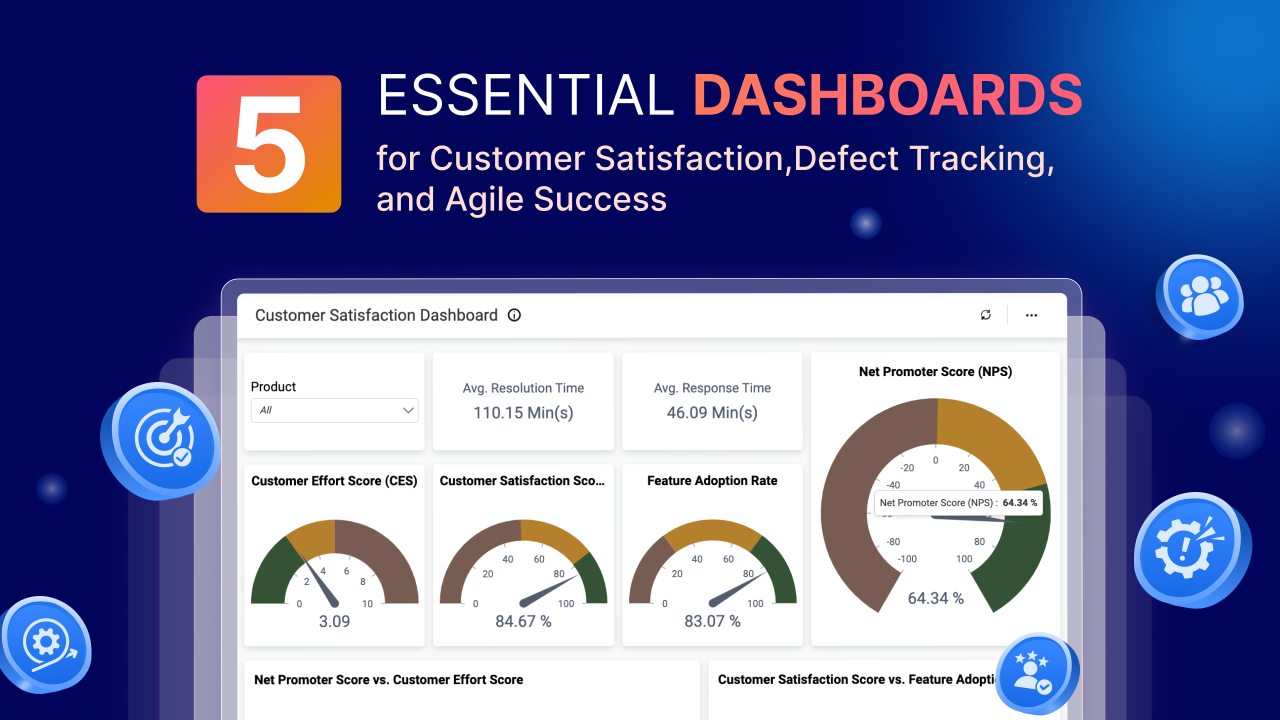
1. Customer Satisfaction Dashboard: Turning Insights into Loyalty ??
This dashboard helps you understand the customer experience, turning satisfaction data into long-term loyalty.
Key Metrics:
Pro Tip: Regularly reviewing these metrics fosters a customer-centered culture that builds loyalty.
2. Defect Management Dashboard: Quality Assurance at Every Step ??
Proactive defect tracking ensures your team prioritizes critical issues to keep quality on point.
Key Metrics:
Cautionary Note: Maintaining product quality builds user trust. Stay vigilant.
3. Agile Release Management Dashboard: Ready for Every Release
Keep Agile releases efficient and aligned with team and user expectations.
Key Metrics:
Optimistic Insight: Each release brings you closer to a product that stands out in the market.
领英推荐
4. Sprint Management Dashboard: Stay Aligned and Achieve Goals
This dashboard supports Agile teams in staying focused on sprint goals and adapting in real-time.
Key Metrics:
Encouraging Reminder: Well-defined metrics keep teams motivated and prepared.
5. Team Management Dashboard: Balance Productivity and Team Health
Monitor productivity and morale for a balanced, high-performing team.
Key Metrics:
Cautionary Advice: A balanced team is a productive team. Monitoring morale supports long-term performance.
Free resources:
Conclusion: Drive Success with Data-Driven Dashboards
Incorporating these dashboards into your project management strategy enables better decision-making, efficiency, and customer satisfaction. By focusing on these critical metrics, you empower your team to achieve goals confidently.
Did you find this helpful?
That’s all for this week. More insights are coming your way next week!
Subscribe now and stay up to date with the latest Bold BI announcements, including platform updates, new features, and community news.
?? We value your feedback—it helps us make our product even better for you!
?? Share your thoughts on G2: Click Here
P.S. Ready to transform data into actionable steps? Try Bold BI free for 15 days and see the difference!